Remove technologies elasticsearch-monitoring
article thumbnail

Ensuring the Successful Launch of Ads on Netflix

The Netflix TechBlog

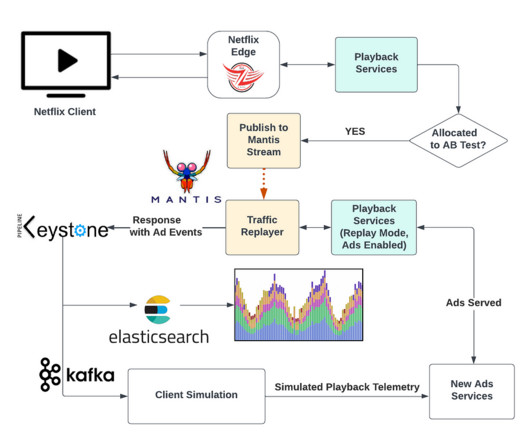
In this blog post, we’ll discuss the methods we used to ensure a successful launch, including: How we tested the system Netflix technologies involved Best practices we developed Realistic Test Traffic Netflix traffic ebbs and flows throughout the day in a sinusoidal pattern. We used Elasticsearch dashboards to analyze results.

Traffic 342
article thumbnail

Unlock the observability value of log data with processing at scale

Dynatrace

In this example, FILTER_OUT() is used to drop all logs where the duration of the call is under 100 ms: PARSE(content, "LD 'My monitored service call took ' INT:duration 'ms'"). The new attribute batchjobs.time can then be converted into a metric for monitoring. FILTER_OUT(duration < 100). time + batchjob2.time)).

Insiders

Sign Up for our Newsletter

This site is protected by reCAPTCHA and the Google Privacy Policy and Terms of Service apply.

Trending Sources

article thumbnail

Dynatrace Managed turnkey Premium High Availability for globally distributed data centers (Early Adopter)

Dynatrace

We’re therefore proud to announce Premium High Availability for Dynatrace Managed to address exactly this need in a completely turnkey manner without any external load balancing or replication technologies. Near-zero RPO and RTO—monitoring continues seamlessly and without data loss in failover scenarios.

article thumbnail

Top 13 Site Reliability Engineer (SRE) Tools

Dotcom-Montior

A typical SRE is busy automating, cleaning up code, upgrading servers, and continually monitoring dashboards for performance, etc., Containerization and microservices have quickly become a crucial technology for allowing organizations to more quickly develop and release applications, as well as scaling them across different environments.

article thumbnail

Are Times still Good for Load Testing?

Alex Podelko

Another trend is to integrate them with other products to provide needed functionality – such as monitoring, analysis, and reporting. Often they get integrated with the TICK stack (Telegraf, InfluxDB, Chronohraf, Kapasitor) , the ELK stack (Elasticsearch, Logstash, Kibana) , Prometheus , and Grafana. Any thoughts?

Testing 243
article thumbnail

Extend the AI and automation core of Dynatrace with custom plugins

Dynatrace

For full-stack monitoring, you need 360-degree visibility from each customer’s initial interaction with your applications, through the entire request call sequence, down to containers, infrastructure, and cloud. Monitor and analyze any remote technology with ActiveGate plugins. Dynatrace news.

Java 35
article thumbnail

Top 13 Site Reliability Engineer (SRE) Tools

Dotcom-Montior

A typical SRE is busy automating, cleaning up code, upgrading servers, and continually monitoring dashboards for performance, etc., Containerization and microservices have quickly become a crucial technology for allowing organizations to more quickly develop and release applications, as well as scaling them across different environments.