Remove news opentelemetry-demo-identifying-metrics-traces
article thumbnail

Observability engineering: Getting Prometheus metrics right for Kubernetes with Dynatrace and Kepler

Dynatrace

To get a more granular look into telemetry data, many analysts rely on custom metrics using Prometheus. Named after the Greek god who brought fire down from Mount Olympus, Prometheus metrics have been transforming observability since the project’s inception in 2012.

Metrics 177
article thumbnail

Dynatrace adds OpenTelemetry trace ingest for open, automatic, and intelligent observability

Dynatrace

Dynatrace news. Any observability blind spot imposes a risk, potentially increasing the time it takes to identify the root cause of a problem and address it. cloud service providers are now starting to add OpenTelemetry instrumentation as an out-of-the-box feature. Announcing OpenTelemetry trace ingest.

Cloud 264
Insiders

Sign Up for our Newsletter

This site is protected by reCAPTCHA and the Google Privacy Policy and Terms of Service apply.

Trending Sources

article thumbnail

TTP-based threat hunting with Dynatrace Security Analytics and Falco Alerts solves alert noise

Dynatrace

In this blog post, we’ll use Dynatrace Security Analytics to go threat hunting, bringing together logs, traces, metrics, and, crucially, threat alerts. In the following sections, we demo the following: Introduce Unguard, our insecure cloud-native microservices demo application.

Analytics 195
article thumbnail

AWS EKS Monitoring as a Self-Service with Dynatrace

Dynatrace

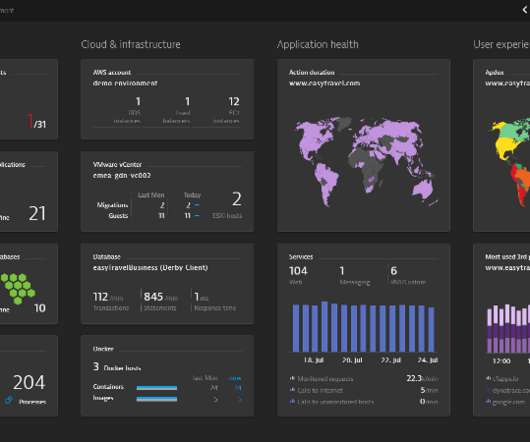
Dynatrace news. End-to-end code-level tracing. Instead of presenting you with a handful of random screenshots from our demo environment I reached out to Robert, a close friend of mine, who leads a development team with the current task to re-architect and re-platform their multi-tenant SaaS-based eCommerce platform.

AWS 127
article thumbnail

Observability platform vs. observability tools

Dynatrace

Dynatrace news. Observability is made up of three key pillars: metrics, logs, and traces. Metrics are measures of critical system values, such as CPU utilization or average write latency to persistent storage. Traces provide performance data about tasks that are performed by invoking a series of services.

article thumbnail

Observability vs. monitoring: What’s the difference?

Dynatrace

Dynatrace news. It’s essential to understand when something goes wrong along the application delivery chain so you can identify the root cause and correct it before it impacts your business. Monitoring focuses on watching specific metrics. This trend is prompting advances in both observability and monitoring.

article thumbnail

Infrastructure Monitoring tools: 3 steps to evolve ITOps into AIOps

Dynatrace

Dynatrace news. Reducing downtime, improving user experience, speed, reliability, and flexibility, and ensuring IT investments are delivering on promised ROI across local IT stacks and in the cloud. ” Here, collecting metrics and monitoring performance help evaluate the efficacy of services rather than simply identifying their state.