article thumbnail

2023 Black Friday and Cyber Monday retail and e-commerce IT performance observations

Dynatrace

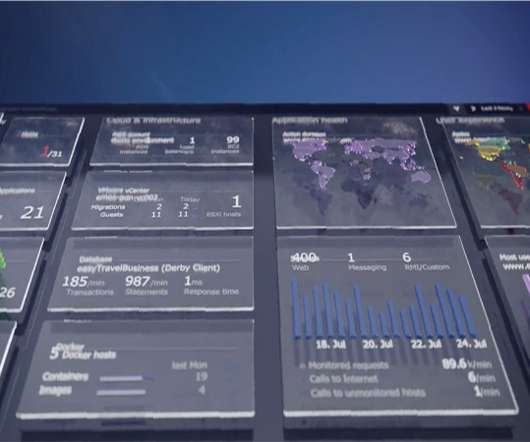
Over the years, I have watched and written about online retail and e-commerce IT performance. What I have seen is a maturing of the online retail channels when it comes to delivering customer experiences. This year we saw few, if any, major issues with online retailers. This is where many retailers have matured over the years.

Retail 221
article thumbnail

The new normal of digital experience delivery – lessons learned from monitoring mission-critical websites during COVID-19

Dynatrace

Over the last two month s, w e’ve monito red key sites and applications across industries that have been receiving surges in traffic , including government, health insurance, retail, banking, and media. Monitoring with ?the We ’ve also been monitoring U. Media p erformance . the Dynatrace®?

Website 215
Insiders

Sign Up for our Newsletter

This site is protected by reCAPTCHA and the Google Privacy Policy and Terms of Service apply.

Trending Sources

article thumbnail

How digital experience monitoring helps deliver business observability

Dynatrace

Digital experience monitoring (DEM) allows an organization to optimize customer experiences by taking into account the context surrounding digital experience metrics. What is digital experience monitoring? Primary digital experience monitoring tools.

article thumbnail

COVID-19 and Digital Services: An Action Plan for the Unexpected

Dynatrace

While most government agencies and commercial enterprises have digital services in place, the current volume of usage — including traffic to critical employment, health and retail/eCommerce services — has reached levels that many organizations have never seen before or tested against. Let’s look at news/media sites, for example (figure 6).

Traffic 206
article thumbnail

Cumulative Layout Shift: What it measures, when it works (and doesn't), and how to use it

Speed Curve

Back in May, we shared that SpeedCurve supports Google's Core Web Vitals in both our synthetic monitoring and LUX real user monitoring tools. Fortunately, we have the ability to do both those things in synthetic and real user monitoring (RUM). What does a poor CLS score look like? Learn more about correlation charts here.).

Retail 80
article thumbnail

Sampling RUM: When and why it's a good idea

Speed Curve

When it comes to real user monitoring (RUM), I’m convinced that the marginal cost of collection, computation, storage, etc. While certainly not an exhaustive list, here are some questions you might ask when looking at implementing a sampled approach to real user monitoring. Are sessions important to you? That’s fine, too!

Retail 59
article thumbnail

2022 in review: New dashboards, Core Web Vitals enhancements, third-party tracking & more!

Speed Curve

Hint: If you're considering installing a big-screen performance monitor at your organization, this dashboard is a good candidate for that.). Performance in different geolocations around the world. Your current competitive benchmarks status. Top Lighthouse recommendations for performance improvements. Synthetic Site dashboard.