Remove Benchmarking Remove Media Remove Monitoring Remove Retail
article thumbnail

2023 Black Friday and Cyber Monday retail and e-commerce IT performance observations

Dynatrace

Over the years, I have watched and written about online retail and e-commerce IT performance. What I have seen is a maturing of the online retail channels when it comes to delivering customer experiences. This year we saw few, if any, major issues with online retailers. This is where many retailers have matured over the years.

Retail 221
article thumbnail

2022 in review: New dashboards, Core Web Vitals enhancements, third-party tracking & more!

Speed Curve

Your current competitive benchmarks status. Hint: If you're considering installing a big-screen performance monitor at your organization, this dashboard is a good candidate for that.). Expanded Industry Speed Benchmarks. The current status of your performance budgets. Performance in different geolocations around the world.

Insiders

Sign Up for our Newsletter

This site is protected by reCAPTCHA and the Google Privacy Policy and Terms of Service apply.

Trending Sources

article thumbnail

Cumulative Layout Shift: What it measures, when it works (and doesn't), and how to use it

Speed Curve

Back in May, we shared that SpeedCurve supports Google's Core Web Vitals in both our synthetic monitoring and LUX real user monitoring tools. Fortunately, we have the ability to do both those things in synthetic and real user monitoring (RUM). What does a poor CLS score look like? Learn more about correlation charts here.).

Retail 81
article thumbnail

An Opinionated Guide to Performance Budgets

Speed Curve

You can then configure your monitoring tools to send you alerts – or even break the build, if you're testing in your staging environment – when your budgets are violated. For each of these metrics, I've included what type of tool you can use to track them: synthetic and/or real user monitoring (RUM). Is it loading?

article thumbnail

Why you need to know your site's performance poverty line (and how to find it)

Speed Curve

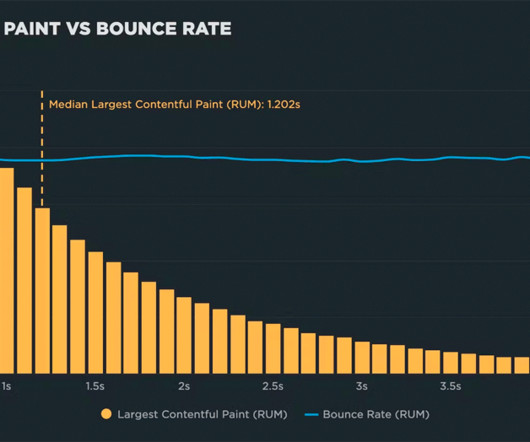
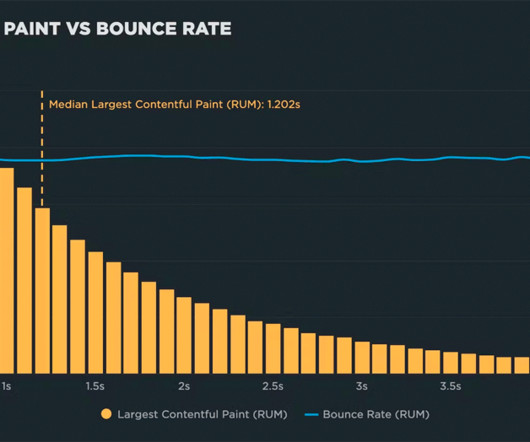
For each site, I used a month's worth of RUM (real user monitoring) data to generate correlation charts. If you're new to performance, you might be interested in this synthetic and real user monitoring explainer.) If you work on a media site, then page views and bounce rate matter. You need to look at your own real user data. (If

article thumbnail

2021 in review: It was a big year!

Speed Curve

If you want to understand how people actually experience your site, then you need to monitor real users. We also added a "Performance 101" section that includes articles like: Synthetic vs. Real User Monitoring. Web Performance for Retailers. Industry speed benchmarks for Japan. Visibility is the first step! for everyone.

Retail 52
article thumbnail

A Complete Guide to Performance Budgets

Speed Curve

You can then configure your monitoring tools to send you alerts – or even break the build, if you're testing in your staging environment – when your budgets are violated. Media sites are particularly prone to this issue. Let's get started! Background: How performance budgets work 1. What is a performance budget?