article thumbnail

Extend business observability: Extract business events from online databases (Part 2)

Dynatrace

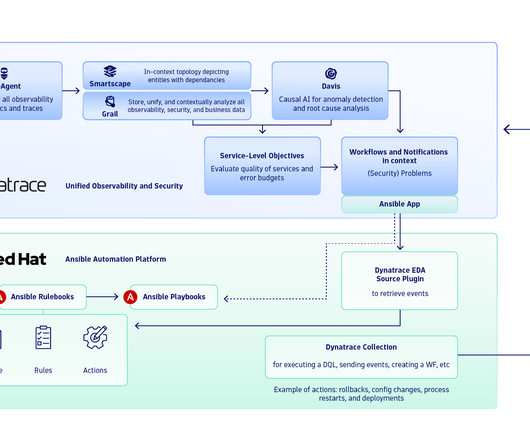
Dataflow overview Dynatrace ActiveGate extensions allow you to extend Dynatrace monitoring to any remote technology that exposes an interface. Dynatrace users typically use extensions to pull technical monitoring data, such as device metrics, into Dynatrace. There are three high-level steps to set up the database business-event stream.

Database 274
article thumbnail

The value of business events: How IT can increase business agility

Dynatrace

Business events are a special class of events, new to Business Analytics; together with Grail, our data lakehouse, they provide the precision and advanced analytics capabilities required by your most important business use cases. What are business events? This diagram shows a few examples of business events.

Analytics 232
Insiders

Sign Up for our Newsletter

This site is protected by reCAPTCHA and the Google Privacy Policy and Terms of Service apply.

Trending Sources

article thumbnail

Extract metrics from business events to increase the value of business analytics

Dynatrace

But are observability platforms—born from the collision between the demands of cloud computing and the limitations of APM and infrastructure monitoring—the best solution for managing business analytics? Observability fault lines The monitoring of complex and dynamic IT systems includes real-time analysis of baselines, trends, and anomalies.

Analytics 207
article thumbnail

Network performance monitoring top of mind for CloudOps teams

Dynatrace

For cloud operations teams, network performance monitoring is central in ensuring application and infrastructure performance. Network performance monitoring core to observability For these reasons, network activity becomes a key data source in IT observability. But this approach merely perpetuates data silos and cloud complexity.

Network 221
article thumbnail

Why growing AI adoption requires an AI observability strategy

Dynatrace

An AI observability strategy—which monitors IT system performance and costs—may help organizations achieve that balance. AI requires more compute and storage. Training AI data is resource-intensive and costly, again, because of increased computational and storage requirements. Continuously monitor AI models’ performance.

Strategy 227
article thumbnail

Discover the power of the Dynatrace platform on Azure with Azure Native Dynatrace Service

Dynatrace

One-click activation of log collection and Azure Monitor metric collection in the Microsoft Azure Portal allows instant ingest of Azure Monitor logs and metrics into the Dynatrace platform. Dashboards leverages the power of DQL for Azure monitoring in one place. There’s no need for configuration or setup of any infrastructure.

Azure 221
article thumbnail

Easily monitor your entire infrastructure with Dynatrace Synthetic monitors

Dynatrace

Dynatrace OneAgent is great for monitoring the full stack. There are certain situations when an agent based approach isn’t possible, such as with network or storage devices, or a very old OS. While this will give you a lot of information about the health of these components, sometimes a simple synthetic monitor is sufficient.