Remove Database Remove Infrastructure Remove Java Remove Monitoring
article thumbnail

Building Netflix’s Distributed Tracing Infrastructure

The Netflix TechBlog

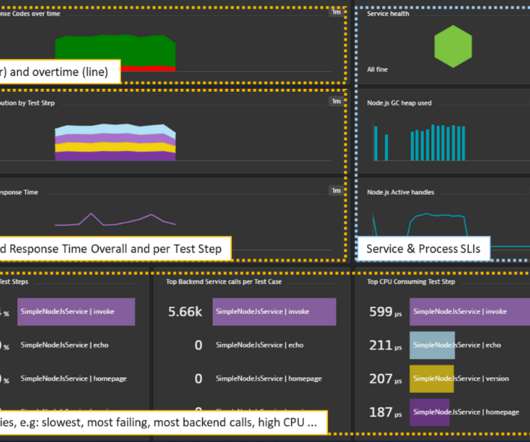
Now let’s look at how we designed the tracing infrastructure that powers Edgar. This insight led us to build Edgar: a distributed tracing infrastructure and user experience. Our tactical approach was to use Netflix-specific libraries for collecting traces from Java-based streaming services until open source tracer libraries matured.

article thumbnail

Automatic and intelligent end-to-end observability for OpenTelemetry Java

Dynatrace

Today, Dynatrace is happy to announce OneAgent support for discovering and automatically capturing OpenTelemetry trace data for Java. PurePath integrates OpenTelemetry Java data for enterprise-grade collection and contextual analytics. Enriching local monitoring data with project-specific additions.

Java 154
Insiders

Sign Up for our Newsletter

This site is protected by reCAPTCHA and the Google Privacy Policy and Terms of Service apply.

Trending Sources

article thumbnail

Dynatrace extends AI-powered observability for SAP together with PowerConnect

Dynatrace

Monitoring SAP products can present challenges Monitoring SAP systems can be challenging due to the inherent complexity of using different technologies—such as ABAP, Java, and cloud offerings—and the sheer amount of generated data. SAP HANA server infrastructure monitored with OneAgent.

Java 185
article thumbnail

Unmatched scalability and security of Dynatrace extensions now available for all supported technologies: 7 reasons to migrate your JMX and Python plugins

Dynatrace

already address SNMP, WMI, SQL databases, and Prometheus technologies, serving the monitoring needs of hundreds of Dynatrace customers. JMX monitoring extensions are currently being migrated. Extensions can monitor virtually any type of technology in your environment. and focusing on a much-improved version 2.0

article thumbnail

Boost application performance with improved CPU analysis across all your deep-monitored workloads

Dynatrace

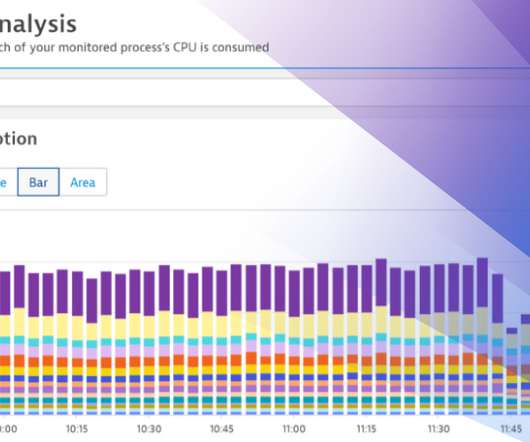
Apart from its best-in-class observability capabilities like distributed traces, metrics, and logs, Dynatrace OneAgent additionally provides automatic deep code-level insights for Java,NET, Node.js, PHP, and Golang, without the need to change any application code or configuration.

article thumbnail

What is a message queue? How an observability platform eases message queue monitoring

Dynatrace

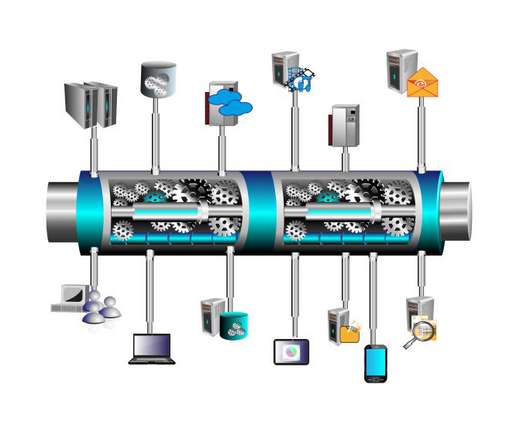
TIBCO Enterprise Message Service features compatibility with software written in Java. The problem could be in the database, the HTTP connection, the configuration of the message, or an outage on the sending or receiving end. How an observability platform eases message queue monitoring appeared first on Dynatrace blog.