Remove category devtools
article thumbnail

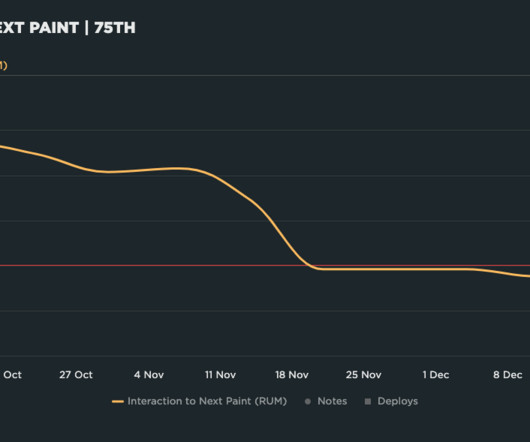
Debugging Interaction to Next Paint (INP)

Speed Curve

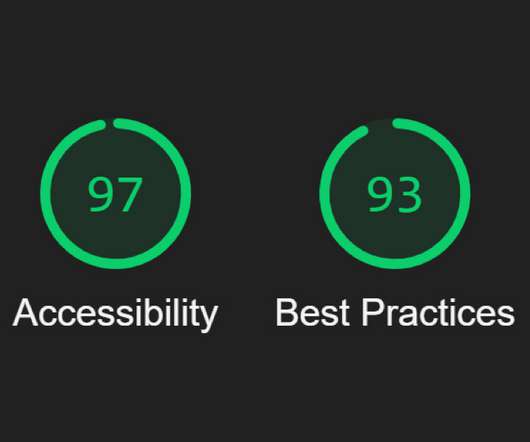
Like all Core Web Vitals, INP has a set of thresholds: INP thresholds for Good, Needs Improvement, and Poor Many sites tend to be in the Needs Improvement or Poor categories. These may get populated during testing, but we can clear them at any time via Application > Storage > Clear Site Data in DevTools.

article thumbnail

An Introduction To Running Lighthouse Programmatically

Smashing Magazine

One of the simplest ways to run Lighthouse is through Chrome’s DevTools Lighthouse panel. If you open your site in Chrome and then open Chrome’s DevTools, you should see a “Lighthouse” tab. You can use this object to do a multitude of things, including specifying which Lighthouse test categories you want to test.

Mobile 116
Insiders

Sign Up for our Newsletter

This site is protected by reCAPTCHA and the Google Privacy Policy and Terms of Service apply.

Trending Sources

article thumbnail

The Three Types of Performance Testing

CSS Wizardry

To combat this, and make performance testing regular and routine, I try to distill the types of testing that we do into three distinct categories: Proactive , Reactive , and Passive. How: DevTools, browsers, local tooling. When something is everyone’s responsibility, it normally becomes no one’s responsibility. Who: Engineers.

article thumbnail

WaterBear: Building A Free Platform For Impactful Documentaries (Part 2)

Smashing Magazine

Image Optimization Images are pieces of content in many contexts, and they are a very important and prominent part of the WaterBear app’s experience, from video posters and category banners to partner logos and campaign image assets. After scrolling the video category page, a bunch more images are loaded.

Cache 72
article thumbnail

How To Fix Cumulative Layout Shift (CLS) Issues

Smashing Magazine

width="400" height="400"> You can find the dimensions of the image by opening DevTools and hovering over (or tapping through) the element. Chrome DevTools shows the image dimensions and aspect ratios when hovering over an element. Open DevTools go to the very intimidating (but very useful once you get a hang of it!)

Media 125
article thumbnail

Continuous Performance Analysis with Lighthouse CI and GitHub Actions

CSS - Tricks

The easiest way to use it is through the Chrome DevTools panel. Once you open the DevTools, you will see a “Lighthouse” tab. The above configuration asserts a baseline score of 90 for the performance and accessibility categories. The result of any audit in Lighthouse can be asserted so there’s so much you can do here.

article thumbnail

Measuring Performance With Server Timing

Smashing Magazine

Studying your network waterfall chart in developer tools will show this delay up under the category of “Waiting (TTFB)”. For browser support, the best I’ve seen is in Chrome DevTools, and that’s what I’ve used for the screenshots in this article. Considerations.

Servers 87