Remove Benchmarking Remove Download Remove Metrics Remove Retail
article thumbnail

Performance audit: Lego.com

Speed Curve

We track LEGO.com, along with a handful of other leading ecommerce sites, in our public-facing Retail Benchmarks dashboard , which I encourage you to check out. It shows how key metrics align with the rendering timeline (the filmstrip view at the top of the chart). This is a high-level waterfall for the LEGO.com home page.

article thumbnail

eCommerce & Retail: There’s No Excuse to Ignore Performance

Rigor

Whether it be time, money, or technical know how, every day we talk to eCommerce and Retail teams who explain why they aren’t monitoring their site’s performance. Since our team is preparing for eTail West , there is no better time to address some of the common objections I’ve seen when talking to eCommerce and Retail teams about performance.

Insiders

Sign Up for our Newsletter

This site is protected by reCAPTCHA and the Google Privacy Policy and Terms of Service apply.

Trending Sources

article thumbnail

Introducing Page Speed Benchmarks – a new resource for the performance community

Speed Curve

Here are some common questions I’m asked when I talk with people about performance: Which metrics should I care about? What are some good sites I can use for benchmarking? With Page Speed Benchmarks, you can do things like: See what the different metrics actually mean in terms of user-perceived performance.

article thumbnail

Data Mining Problems in Retail

Highly Scalable

Retail is one of the most important business domains for data science and data mining applications because of its prolific data and numerous optimization problems such as optimal prices, discounts, recommendations, and stock levels that can be solved using data analysis methods. However, many of these models are highly parametric (i.e.

Retail 152
article thumbnail

World’s Top Web Performance Leaders To Watch

Rigor

Developers representing hundreds of companies work together at these meetups to become masters in performance metrics and the latest trends in measuring site speed.) And, of course, you should follow him on Twitter @ igrigorik for in-depth insights on web performance metrics, user experience, and industry news. Maximiliano Firtman.

article thumbnail

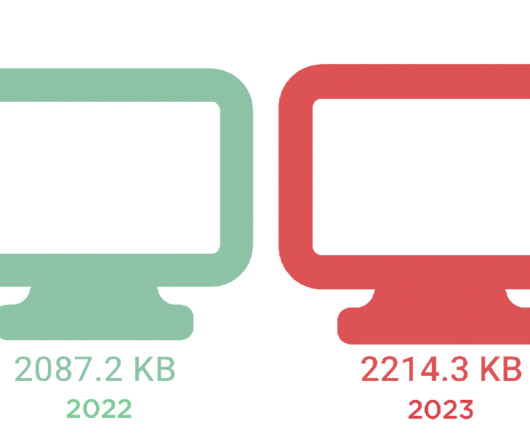
Ten years of page bloat: What have we learned?

Speed Curve

How does page bloat affect other metrics, such as Google's Core Web Vitals? And if that already wasn’t enough, the number of images on a page has been linked to lower conversion rates on retail sites. These numbers should not be taken as a benchmark for your own site. How does page bloat hurt your business?

Mobile 145
article thumbnail

First Interactive Metrics Add New Dimensions To User Experience Data (9 min read)

Rigor

Visual Metrics Alone Paint Only Half The Picture. Existing metrics like DOM Content Loaded and Onload Time are giving way to user-centric metrics such as visual timings and user timings. Interactivity metrics can provide insight and uncover blind spots not yet realized and are a valuable addition to your metrics arsenal.

Metrics 40