Remove Benchmarking Remove Blog Remove Hardware Remove Latency
article thumbnail

How To Scale a Single-Host PostgreSQL Database With Citus

Percona

PostgreSQL Cluster One coordinator node citus-coord-01 Three worker nodes citus1 citus2 citus3 Hardware AWS Instance Ubuntu Server 20.04, SSD volume type 64-bit (x86) c5.xlarge And now, execute the benchmark: -- execute the following on the coordinator node pgbench -c 20 -j 3 -T 60 -P 3 pgbench The results are not pretty.

Database 108
article thumbnail

Crucial Redis Monitoring Metrics You Must Watch

Scalegrid

This blog post lists the important database metrics to monitor. Key Takeaways Critical performance indicators such as latency, CPU usage, memory utilization, hit rate, and number of connected clients/slaves/evictions must be monitored to maintain Redis’s high throughput and low latency capabilities.

Metrics 130
Insiders

Sign Up for our Newsletter

This site is protected by reCAPTCHA and the Google Privacy Policy and Terms of Service apply.

Trending Sources

article thumbnail

Why you should benchmark your database using stored procedures

HammerDB

HammerDB uses stored procedures to achieve maximum throughput when benchmarking your database. HammerDB has always used stored procedures as a design decision because the original benchmark was implemented as close as possible to the example workload in the TPC-C specification that uses stored procedures. On MySQL, we saw a 1.5X

article thumbnail

How to maximize CPU performance for PostgreSQL 12.0 benchmarks on Linux

HammerDB

HammerDB doesn’t publish competitive database benchmarks, instead we always encourage people to be better informed by running their own. So over at Phoronix some database benchmarks were published showing PostgreSQL 12 Performance With AMD EPYC 7742 vs. Intel Xeon Platinum 8280 Benchmarks .

article thumbnail

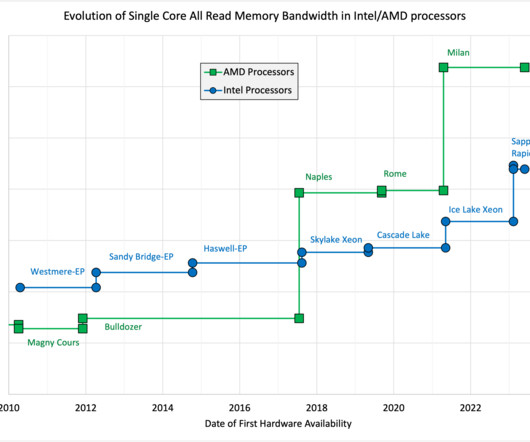
The evolution of single-core bandwidth in multicore processors

John McCalpin

Some I will address today, and some in the next blog entry. link] ) For the single-core case the bandwidth reported by the STREAM benchmark kernels is very close to the same as the bandwidth for the all-read tests reported here. Details in the next blog entry.) These observations naturally give rise to a variety of questions.

article thumbnail

InnoDB Performance Optimization Basics

Percona

This blog is in reference to our previous ones for ‘Innodb Performance Optimizations Basics’ 2007 and 2013. Although there have been many blogs about adjusting MySQL variables for better performance since then, I think this topic deserves a blog update since the last update was a decade ago, and MySQL 5.7

article thumbnail

The Speed of Time

Brendan Gregg

A Cassandra database cluster had switched to Ubuntu and noticed write latency increased by over 30%. As a Xen guest, this profile was gathered using perf(1) and the kernel's software cpu-clock soft interrupts, not the hardware NMI. html [unroll the loop]: /blog/2014-04-26/the-noploop-cpu-benchmark.html include <sys/time.h>

Speed 126