Remove Analytics Remove Metrics Remove Retail Remove Traffic
article thumbnail

Five questions with Forrester Analyst: The state of the UK Retail landscape

Dynatrace

For retail, in particular, the crisis has forced many to accelerate the execution of strategic plans for digital customer experience and operational excellence. Consumers may be more likely to interact more “digitally” with brands going forward, and online sales are expected to make up a greater proportion of overall retail sales.


Retail 182
article thumbnail

How digital experience monitoring helps deliver business observability

Dynatrace

Fast, consistent application delivery creates a positive user experience that can ultimately drive customer loyalty and improve business metrics like conversion rate and user retention. It is proactive monitoring that simulates traffic with established test variables, including location, browser, network, and device type.

Insiders

Sign Up for our Newsletter

This site is protected by reCAPTCHA and the Google Privacy Policy and Terms of Service apply.

Trending Sources

article thumbnail

Five-nines availability: Always-on infrastructure delivers system availability during the holidays’ peak loads

Dynatrace

For retail organizations, peak traffic can be a mixed blessing. While high-volume traffic often boosts sales, it can also compromise uptimes. The nightmare scenario for online retailers during peak periods, such as Black Friday and Cyber Monday, is a system crash. Gather observability data from all digital touchpoints.

article thumbnail

Why you need to know your site's performance poverty line (and how to find it)

Speed Curve

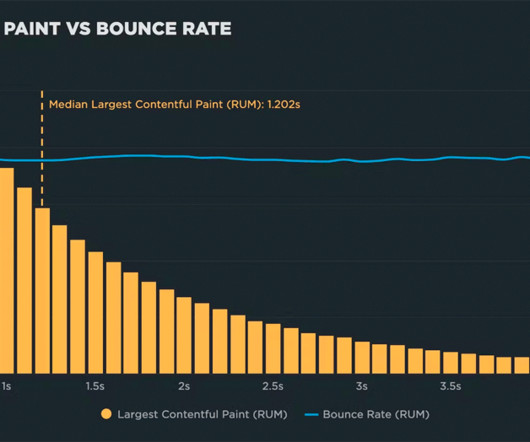
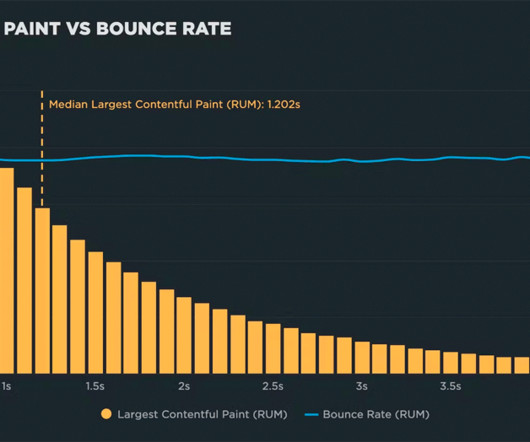
"I made my pages faster, but my business and user engagement metrics didn't change. The performance poverty line is the plateau at which changes to your website’s rendering metrics (such as Start Render and Largest Contentful Paint) cease to matter because you’ve bottomed out in terms of business and user engagement metrics.

article thumbnail

Sampling RUM: When and why it's a good idea

Speed Curve

This helps us do things like: correlate various performance metrics with user behavior, understand the user journey and popular pages so you can better model your synthetic testing, and. A lot of performance users really love that they can track business metrics specific to a session alongside their performance data.

Retail 59
article thumbnail

Why you need to know your site's performance plateau (and how to find it)

Speed Curve

"I made my pages faster, but my business and user engagement metrics didn't change. The performance plateau is the point at which changes to your website’s rendering metrics (such as Start Render and Largest Contentful Paint) cease to matter because you’ve bottomed out in terms of business and user engagement metrics.

article thumbnail

Understanding the Importance of 5 Nines Availability

IO River

determining a business's value to its clients, the level of service it provides is often a key metric. one of the world's largest online retailers, Amazon relies heavily on its website and digital infrastructure to facilitate sales and generate revenue. In 2013, Amazon experienced a brief outage that lasted approximately 30 minutes.