Remove Analytics Remove Benchmarking Remove Metrics Remove Testing
article thumbnail

Implementing service-level objectives to improve software quality

Dynatrace

By implementing service-level objectives, teams can avoid collecting and checking a huge amount of metrics for each service. Instead, they can ensure that services comport with the pre-established benchmarks. This process includes benchmarking realistic SLO targets based on statistical and probabilistic analysis from Dynatrace.

Software 264
article thumbnail

10 things I love about SpeedCurve (that I think you'll love, too)

Speed Curve

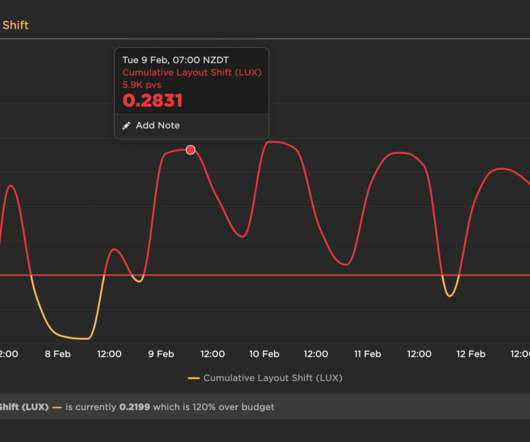
The best way to fight regressions is to create performance budgets on key metrics, and get alerted when they go out of bounds. These charts let even the most non-technical stakeholder easily see the correlation between performance and user engagement and business metrics, such as bounce rate and conversion rate.

Insiders

Sign Up for our Newsletter

This site is protected by reCAPTCHA and the Google Privacy Policy and Terms of Service apply.

Trending Sources

article thumbnail

How BizDevOps can “shift left” using SLOs to automate quality gates

Dynatrace

Quality gates are benchmarks in the software delivery lifecycle that define specific, measurable, and achievable success criteria a service must meet before moving to the next phase of the software delivery pipeline. According to Six Sigma Daily, poor testing leads to overruns amounting to up to 40% of an operation’s budget.

article thumbnail

Lerner?—?using RL agents for test case scheduling

The Netflix TechBlog

using RL agents for test case scheduling By: Stanislav Kirdey , Kevin Cureton , Scott Rick , Sankar Ramanathan Introduction Netflix brings delightful customer experiences to homes on a variety of devices that continues to grow each day. Detect a regression in a test case. These problems could be solved in several different ways.

Testing 163
article thumbnail

How to evaluate modern APM solutions

Dynatrace

APM solutions track key software application performance metrics using monitoring software and telemetry data. These solutions provide performance metrics for applications, with specific insights into the statistics, such as the number of transactions processed by the application or the response time to process such transactions.

article thumbnail

MySQL Key Performance Indicators (KPI) With PMM

Percona

This includes metrics such as query execution time, the number of queries executed per second, and the utilization of query cache and adaptive hash index. Monitoring these metrics helps ensure data protection, minimize downtime, and ensure business continuity. This KPI is also directly related to Query Performance and helps improve it.

article thumbnail

Percona Monitoring and Management 2 Scaling and Capacity Planning

Percona

PMM2 uses VictoriaMetrics (VM) as its metrics storage engine. We have tested PMM version 2.33.0 Please note that the focus of these tests was around standard metrics gathering and display, we’ll use a future blog post to benchmark some of the more intensive query analytics (QAN) performance numbers.