Remove 2020 Remove Architecture Remove DevOps Remove Metrics
article thumbnail

A guide to event-driven SRE-inspired DevOps

Dynatrace

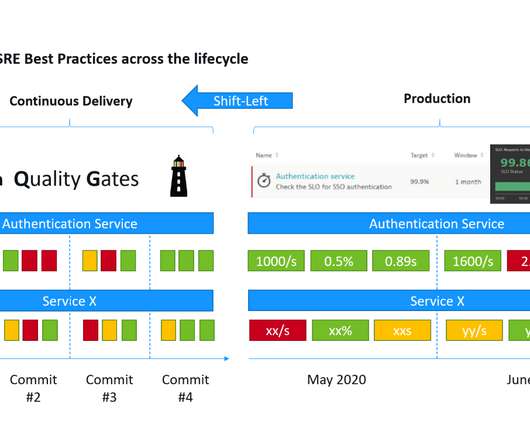
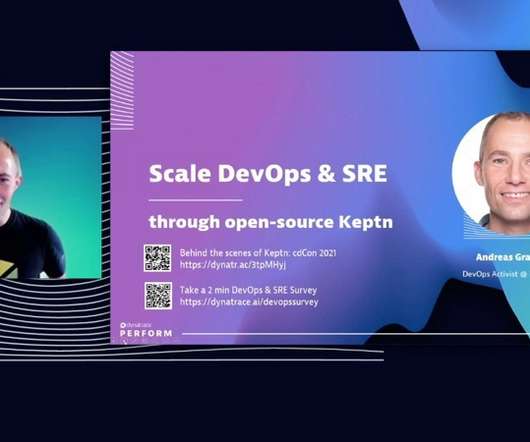
This is a mouthful of buzzwords” is how I started my recent presentations at the Online Kubernetes Meetup as well as the DevOps Fusion 2020 Online Conference when explaining the three big challenges we are trying to solve with Keptn – our CNCF Open Source project: Automate build validation through SLI/SLO-based Quality Gates.

DevOps 245
article thumbnail

What is? OpenTelemetry??An open-source standard for logs, metrics, and traces

Dynatrace

Loosely defined, observability is the ability to understand what’s happening inside a system from the knowledge of the external data it produces, which are usually logs, metrics, and traces. OpenTelemetry reference architecture. Logs, metrics, and traces make up the bulk of all telemetry data. What is telemetry data?

Insiders

Sign Up for our Newsletter

This site is protected by reCAPTCHA and the Google Privacy Policy and Terms of Service apply.

Trending Sources

article thumbnail

AWS Re:Invent 2021 guide: Multicloud modernization and digital transformation

Dynatrace

Serverless architecture enables organizations to deliver applications more efficiently without the overhead of on-premises infrastructure, which has revolutionized software development. These tools simply can’t provide the observability needed to keep pace with the growing complexity and dynamism of hybrid and multicloud architecture.

AWS 225
article thumbnail

Up your quality and agility factor – using automation to build “performance-as-a-self-service”

Dynatrace

The IDC FutureScape: Worldwide IT Industry 2020 Predictions highlights key trends for IT industry-wide technology adoption for the next five years and includes these predictions: Hasten to innovation. This involves new software delivery models, adapting to complex software architectures, and embracing automation for analysis and testing.

article thumbnail

G2 users rate Dynatrace number 1 in observability

Dynatrace

This latest G2 user rating follows a steady cadence of recent industry recognition for Dynatrace, including: Named a leader in The Forrester Wave™: Artificial Intelligence for IT Operations, 2020. Recognized by Gartner as a Leader in Gartner’s 2020 Magic Quadrant Application Performance Monitoring (APM) for the 10th consecutive time.

article thumbnail

Running the OpenTelemetry demo application with Dynatrace

Dynatrace

OpenTelemetry demo application architecture diagram. Jaeger and Prometheus backends for displaying the collected traces and metrics, but you can easily configure alternative backends. Jaeger and Prometheus backends for displaying the collected traces and metrics, but you can easily configure alternative backends. DT_API_TOKEN ?is

article thumbnail

What is?OpenTelemetry??Everything you wanted to know

Dynatrace

Loosely defined, Observability boils down to inferring the internal health and state of a system by looking at the external data it produces, which most commonly are logs, metrics, and traces. The answer is in the data collection, and more specifically, how the logs, metrics, traces are collected. What are the plans for the future?