Remove 2020 Remove Analytics Remove Benchmarking Remove Metrics
article thumbnail

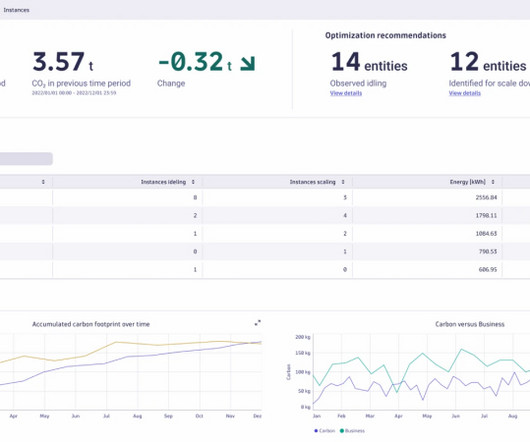
IT carbon footprint: Dynatrace Carbon Impact and Optimization app helps organizations measure cloud computing carbon footprint

Dynatrace

Research from 2020 suggests that training a single LLM generates around 300,000 kg of carbon dioxide emissions—equal to 125 round-trip flights from New York to London. The app’s advanced algorithms and real-time data analytics translate utilization metrics into their CO2 equivalent (CO2e).

Energy 230
article thumbnail

Leading Financial Services Provider Decreases Spend While Increasing Customer Satisfaction Using Flow Metrics 

Tasktop

By adopting value stream management practices, including Flow Metrics, and leveraging insights from Planview Tasktop Viz, this company turned the tides, reducing Flow Time by 70%, improving quality, and leaving customers much happier. The financial services provider focused their attention on three Flow Metrics in Planview Tasktop Viz: .

Metrics 52
Insiders

Sign Up for our Newsletter

This site is protected by reCAPTCHA and the Google Privacy Policy and Terms of Service apply.

Trending Sources

article thumbnail

The State Of Mobile And Why Mobile Web Testing Matters

Smashing Magazine

After all, when we look at our analytics, we will hardly find any customers browsing our sites or apps with a mid-range device on a flaky 3G connection. In the US and the UK, Comscore’s Global State of Mobile 2020 report discovered in August 2020, that mobile usage accounted to 79% and 81% of total digital minutes respectively.

Mobile 133
article thumbnail

Front-End Performance Checklist 2020 [PDF, Apple Pages, MS Word]

Smashing Magazine

Front-End Performance Checklist 2020 [PDF, Apple Pages, MS Word]. Front-End Performance Checklist 2020 [PDF, Apple Pages, MS Word]. 2020-01-06T10:30:13+00:00. 2020-01-06T12:35:48+00:00. Getting Ready: Planning And Metrics. Getting Ready: Planning And Metrics. Vitaly Friedman. Table Of Contents.

article thumbnail

The Performance Inequality Gap, 2021

Alex Russell

The scale of the effect can be deeply situational or hard to suss out without solid metrics. Since then, the metrics conversation has moved forward significantly, culminating in Core Web Vitals , reported via the Chrome User Experience Report to reflect the real-world experiences of users. Today, either method returns a similar answer.

article thumbnail

Web Performance Bookshelf

Rigor

How to pioneer new metrics and create a culture of performance. In her book, Lara Hogan helps you approach projects with page speed in mind, showing you how to test and benchmark which design choices are most critical. You only have a few seconds to get compelling content onto the screen. ” – Andy King, 2003. Time is Money.

article thumbnail

Front-End Performance Checklist 2021

Smashing Magazine

This guide has been kindly supported by our friends at LogRocket , a service that combines frontend performance monitoring , session replay, and product analytics to help you build better customer experiences. LogRocket tracks key metrics, incl. Getting Ready: Planning And Metrics. Get a free trial of LogRocket today.