Remove Media Remove Metrics Remove Retail Remove Traffic
article thumbnail

The new normal of digital experience delivery – lessons learned from monitoring mission-critical websites during COVID-19

Dynatrace

Over the last two month s, w e’ve monito red key sites and applications across industries that have been receiving surges in traffic , including government, health insurance, retail, banking, and media. The following day, a normally mundane Wednesday , traffic soared to 128,000 sessions. seconds to 2.78

Website 215
article thumbnail

How digital experience monitoring helps deliver business observability

Dynatrace

Fast, consistent application delivery creates a positive user experience that can ultimately drive customer loyalty and improve business metrics like conversion rate and user retention. It is proactive monitoring that simulates traffic with established test variables, including location, browser, network, and device type.

Insiders

Sign Up for our Newsletter

This site is protected by reCAPTCHA and the Google Privacy Policy and Terms of Service apply.

Trending Sources

article thumbnail

2022 in review: New dashboards, Core Web Vitals enhancements, third-party tracking & more!

Speed Curve

You can see at a glance: Key metrics like Core Web Vitals and your User Happiness score. Here you can still find time series charts that show how performance is trending over time across a number of key metrics, including Core Web Vitals. Evaluate CDN performance by exploring the impact of time-of-day traffic patterns.

article thumbnail

Sampling RUM: When and why it's a good idea

Speed Curve

This helps us do things like: correlate various performance metrics with user behavior, understand the user journey and popular pages so you can better model your synthetic testing, and. A lot of performance users really love that they can track business metrics specific to a session alongside their performance data.

Retail 59
article thumbnail

Why you need to know your site's performance poverty line (and how to find it)

Speed Curve

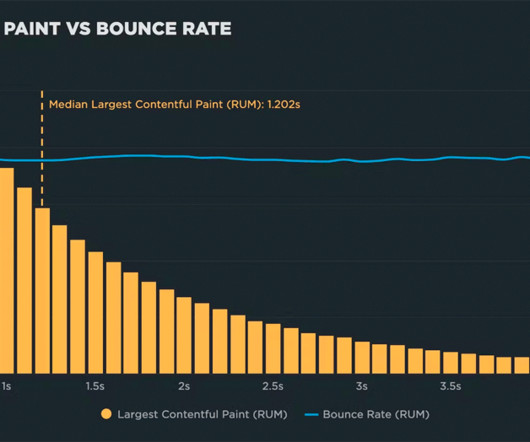
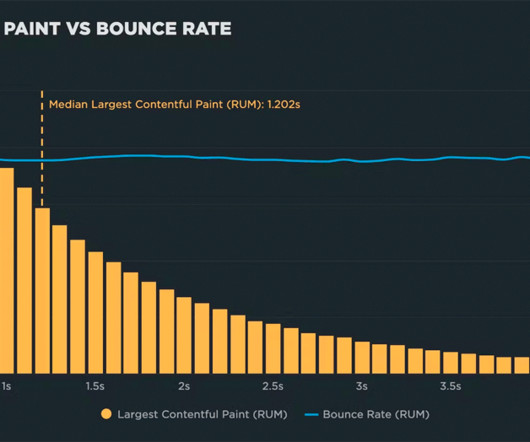
"I made my pages faster, but my business and user engagement metrics didn't change. The performance poverty line is the plateau at which changes to your website’s rendering metrics (such as Start Render and Largest Contentful Paint) cease to matter because you’ve bottomed out in terms of business and user engagement metrics.

article thumbnail

Understanding the Importance of 5 Nines Availability

IO River

determining a business's value to its clients, the level of service it provides is often a key metric. one of the world's largest online retailers, Amazon relies heavily on its website and digital infrastructure to facilitate sales and generate revenue. In 2013, Amazon experienced a brief outage that lasted approximately 30 minutes.