Remove Best Practices Remove Metrics Remove Testing Tools Remove Video
article thumbnail

Release readiness through AI-based white box resiliency testing with JMeter and Dynatrace

Dynatrace

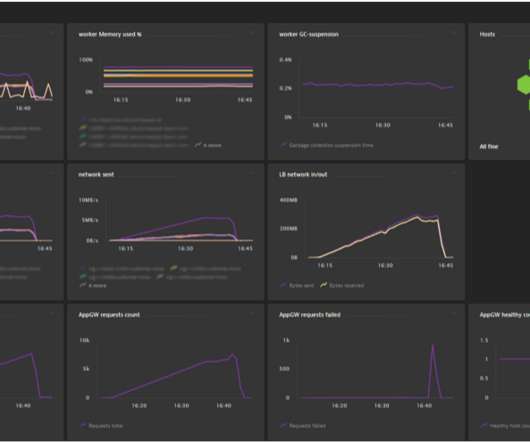
Our solution to modernize this legacy approach is an approach we call white box testing. In white-box testing, we combine open-source load testing tools such as JMeter with Dynatrace’s observability and analytics capabilities. from other test tools or real users). Leveraging the W3C Trace context header.

Testing 226
article thumbnail

Up your quality and agility factor – using automation to build “performance-as-a-self-service”

Dynatrace

Install the Dynatrace OneAgent to gather metrics and feed the Dynatrace AI-powered problem causation engine that automatically shows impacted users, system, and root cause during testing. Check out Dynatrace’s Load testing tool integration. Triage and Optimize many out of the box diagnostic tools.

Insiders

Sign Up for our Newsletter

This site is protected by reCAPTCHA and the Google Privacy Policy and Terms of Service apply.

Trending Sources

article thumbnail

An Opinionated Guide to Performance Budgets

Speed Curve

Web pages are unbelievably complex, and there are hundreds of different metrics available to track. A performance budget is a threshold that you apply to the metrics you care about the most. This is when you run into three important questions: Which metrics should you focus on? Which metrics should you focus on?

article thumbnail

Solving CLS Issues In A Next.js-Powered E-Commerce Website (Case Study)

Smashing Magazine

There are many key performance indicators (KPI) that measure different points during the lifecycle of the web page (such as TTFB, domInteractive and onload ), but these metrics don’t reflect how the end-user experiences the page. We found out user-centric performance metrics to be the perfect fit for this purpose. More after jump!

Website 106
article thumbnail

Search Engine Optimization Checklist (PDF)

Smashing Magazine

Implementing SEO best practice doesn’t just give you the best chance possible of ranking well in search engines; it makes your websites better by scrutinizing quality, design, accessibility, and speed, among other things. Following best practice usually means a better website, more organic traffic, and happier visitors.

article thumbnail

Front-End Performance Checklist 2021

Smashing Magazine

LogRocket tracks key metrics, incl. Getting Ready: Planning And Metrics Performance culture, Core Web Vitals, performance profiles, CrUX, Lighthouse, FID, TTI, CLS, devices. Assets Optimizations Brotli, AVIF, WebP, responsive images, AV1, adaptive media loding, video compression, web fonts, Google fonts. Table Of Contents.

article thumbnail

What Does My Website Look Like From China? Test and Monitor Performance from China

Dotcom-Montior

The good news is there are website monitoring tools specially designed to solve this problem. You may start your diagnosis from our free speed test tool , and no sign up is required. For this article, we ran a speed test for the TED website as the target website. Best Practices. Performance Insights.

Website 52