article thumbnail

2023 Black Friday and Cyber Monday retail and e-commerce IT performance observations

Dynatrace

Over the years, I have watched and written about online retail and e-commerce IT performance. What I have seen is a maturing of the online retail channels when it comes to delivering customer experiences. This year we saw few, if any, major issues with online retailers. This is where many retailers have matured over the years.

Retail 226
article thumbnail

Industry page speed benchmarks (March 2022)

Speed Curve

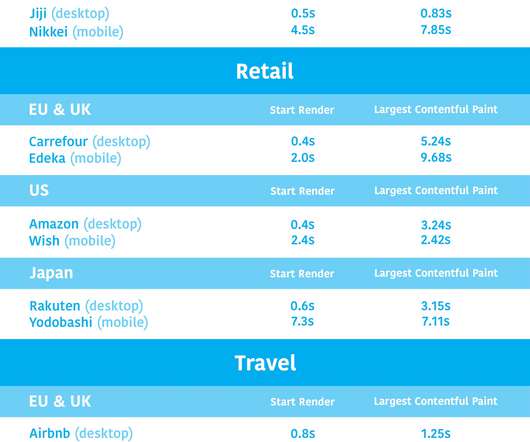
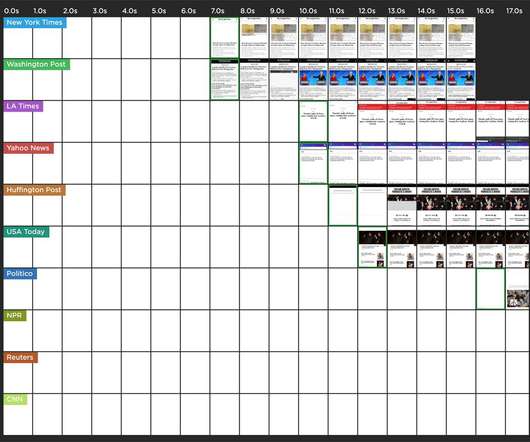
Page Speed Benchmarks is an interactive dashboard that lets you explore and compare web performance data for leading websites across several industries – from retail to media – over the past year. Looking at the screenshots below, you can really see the disparities between metrics, especially for pages served to mobile.

Insiders

Sign Up for our Newsletter

This site is protected by reCAPTCHA and the Google Privacy Policy and Terms of Service apply.

Trending Sources

article thumbnail

Monitor dynamic application workflows with placeholders and synthetic location context

Dynatrace

Synthetic clickpath monitors are a great way to automatically monitor and benchmark business-critical workflows 24/7. Checking out of a retail site. Dynatrace news. Some common examples of such business-critical workflows include: Sign-up processes. Contact forms. Pricing calculators.

article thumbnail

2022 in review: New dashboards, Core Web Vitals enhancements, third-party tracking & more!

Speed Curve

Your current competitive benchmarks status. Expanded Industry Speed Benchmarks. Page Speed Benchmarks is an interactive dashboard that lets you explore and compare web performance data for leading websites across several industries – from retail to media – over the past year. Lots of new videos!

article thumbnail

An Opinionated Guide to Performance Budgets

Speed Curve

Throughout this post I've used examples from our public Industry Benchmarks dashboard , which I'd encourage you to check out so that you can explore these metrics on your own. In an ideal world, pages served to mobile devices should be under 1 MB – and definitely not more than 2 MB – but I often see pages in excess of 5 MB.

article thumbnail

Cumulative Layout Shift: What it measures, when it works (and doesn't), and how to use it

Speed Curve

at the 75th percentile for mobile and desktop devices. SpeedCurve's Industry Benchmarks dashboard – which tracks the performance of top sites in retail, media, travel, and other industries – is a good place to start. Here are the current US media benchmarks on a fast desktop connection , ranked by CLS score.

Retail 81
article thumbnail

Introducing Page Speed Benchmarks – a new resource for the performance community

Speed Curve

What are some good sites I can use for benchmarking? Page Speed Benchmarks is an interactive dashboard that lets you explore and compare web performance data for leading websites across several industries – from retail to media. Identify sites you can use for your own competitive benchmarking.