article thumbnail

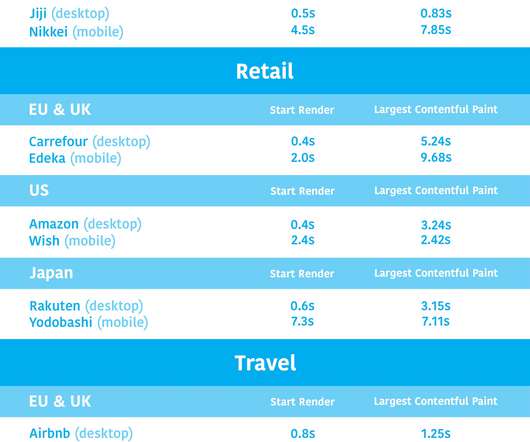
Industry page speed benchmarks (March 2022)

Speed Curve

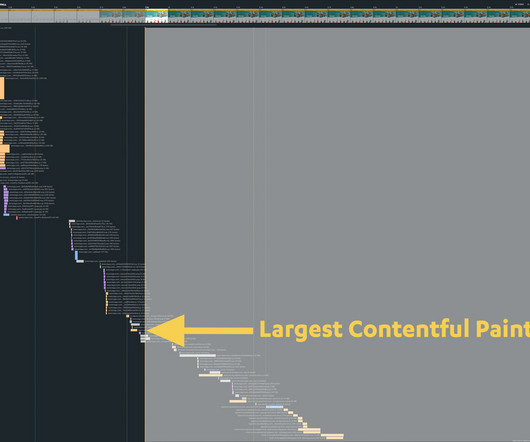
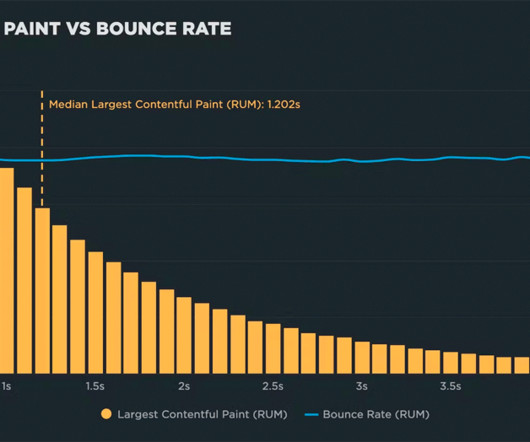
Page Speed Benchmarks is an interactive dashboard that lets you explore and compare web performance data for leading websites across several industries – from retail to media – over the past year. LCP is one of Google's Core Web Vitals , so it should be on your radar, especially if you care about SEO. United States.

article thumbnail

What is FinOps? How to keep cloud spend in check

Dynatrace

Today, many global industries implement FinOps, including telecommunications, retail, manufacturing, and energy conservation, as well as most Fortune 50 companies. Additionally, include benchmarks for stakeholders and best practices that support the anticipated growth of the organization as a whole. FinOps company culture.

Cloud 198
Insiders

Sign Up for our Newsletter

This site is protected by reCAPTCHA and the Google Privacy Policy and Terms of Service apply.

Trending Sources

article thumbnail

Google PageSpeed Insights - Scoring 100/100 with WordPress

KeyCDN

Running speed tests with tools like Google PageSpeed Insights , WebPageTest , or KeyCDN’s Website Speed Test are always a good way to help gauge your website’s performance. With that being said, see how we easily achieved a 100/100 score with WordPress and Google PageSpeed Insights. Why Care About Page Speed?

Google 103
article thumbnail

How to use Server Timing to get backend transparency from your CDN

Speed Curve

Google recommends that TTFB be 800ms at the 75th percentile. Looking at the industry benchmarks for US retailers , four well-known sites have backend times that are approaching – or well beyond – that threshold. For more years than I care to mention, I've been advising folks that their TTFB should be under 500ms.

Servers 57
article thumbnail

eCommerce & Retail: There’s No Excuse to Ignore Performance

Rigor

Whether it be time, money, or technical know how, every day we talk to eCommerce and Retail teams who explain why they aren’t monitoring their site’s performance. Since our team is preparing for eTail West , there is no better time to address some of the common objections I’ve seen when talking to eCommerce and Retail teams about performance.

article thumbnail

Performance audit: Lego.com

Speed Curve

We track LEGO.com, along with a handful of other leading ecommerce sites, in our public-facing Retail Benchmarks dashboard , which I encourage you to check out. According to Google's thresholds, an LCP time of 3.96 Optimizing the critical rendering path could make this page a star on the Retail Benchmarks leaderboard.

article thumbnail

Ten years of page bloat: What have we learned?

Speed Curve

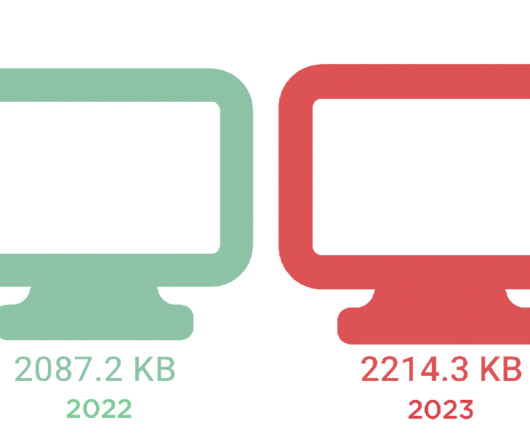
How does page bloat affect other metrics, such as Google's Core Web Vitals? And if that already wasn’t enough, the number of images on a page has been linked to lower conversion rates on retail sites. Image size is another issue, as excessive image weight hurts your SEO ranking in Google Image Search. More on that later.).

Mobile 145