Remove Benchmarking Remove Google Remove Monitoring Remove Retail
article thumbnail

What is FinOps? How to keep cloud spend in check

Dynatrace

Today, many global industries implement FinOps, including telecommunications, retail, manufacturing, and energy conservation, as well as most Fortune 50 companies. Additionally, include benchmarks for stakeholders and best practices that support the anticipated growth of the organization as a whole. FinOps company culture.

Cloud 194
article thumbnail

eCommerce & Retail: There’s No Excuse to Ignore Performance

Rigor

Whether it be time, money, or technical know how, every day we talk to eCommerce and Retail teams who explain why they aren’t monitoring their site’s performance. You don’t have the time to monitor something that affects your company’s revenue and almost every online metric your business cares about ?

Insiders

Sign Up for our Newsletter

This site is protected by reCAPTCHA and the Google Privacy Policy and Terms of Service apply.

Trending Sources

article thumbnail

Ten years of page bloat: What have we learned?

Speed Curve

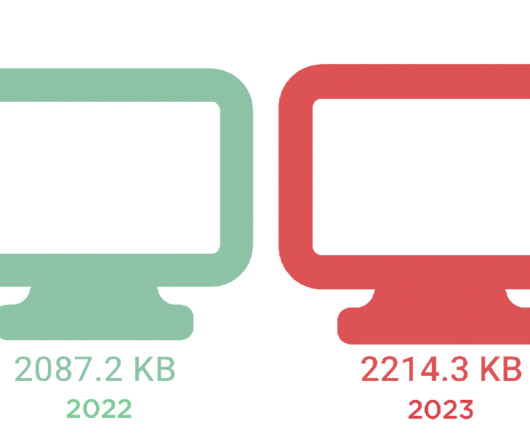
How does page bloat affect other metrics, such as Google's Core Web Vitals? And if that already wasn’t enough, the number of images on a page has been linked to lower conversion rates on retail sites. Image size is another issue, as excessive image weight hurts your SEO ranking in Google Image Search. More on that later.).

Mobile 145
article thumbnail

Cumulative Layout Shift: What it measures, when it works (and doesn't), and how to use it

Speed Curve

Back in May, we shared that SpeedCurve supports Google's Core Web Vitals in both our synthetic monitoring and LUX real user monitoring tools. According to Google, pages should maintain a CLS score of less than 0.1 Fortunately, we have the ability to do both those things in synthetic and real user monitoring (RUM).

Retail 80
article thumbnail

Why you need to know your site's performance poverty line (and how to find it)

Speed Curve

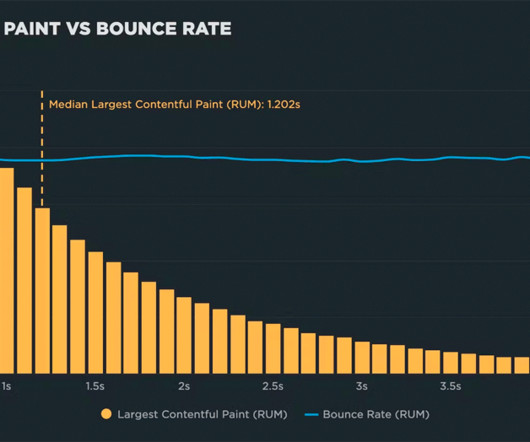
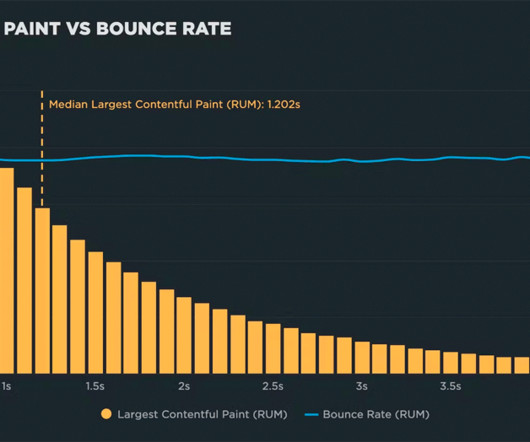
For each site, I used a month's worth of RUM (real user monitoring) data to generate correlation charts. LCP is relatively new, and has received a great deal of attention since it was introduced a couple of years ago as part of Google's Core Web Vitals. You need to look at your own real user data. (If

article thumbnail

An Opinionated Guide to Performance Budgets

Speed Curve

You can then configure your monitoring tools to send you alerts – or even break the build, if you're testing in your staging environment – when your budgets are violated. For each of these metrics, I've included what type of tool you can use to track them: synthetic and/or real user monitoring (RUM). Is it loading?

article thumbnail

2021 in review: It was a big year!

Speed Curve

Google's Core Web Vitals have been a huge topic this year. We've been tracking these as individual metrics – Largest Contentful Paint, First Input Delay, and Cumulative Layout Shift – since before Google branded them as a set. Web Performance for Retailers. Industry speed benchmarks for Japan. for everyone.

Retail 52