article thumbnail

How to use Server Timing to get backend transparency from your CDN

Speed Curve

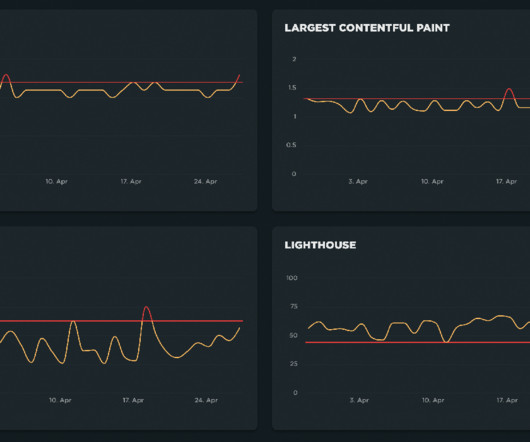
Looking at the industry benchmarks for US retailers , four well-known sites have backend times that are approaching – or well beyond – that threshold. Pagespeed Benchmarks - US Retail - LCP When you examine a waterfall, it's pretty obvious that TTFB is the long pole in the tent, pushing out render times for the page.

Servers 57
article thumbnail

Comparisons of Proxies for MySQL

Percona

Let us take a look also the latency: Here the situation starts to be a little bit more complicated. MySQL Router is the one that has the higher latency no matter what. Looking at the latency, we can see that HAProxy gradually increased as expected, while ProxySQL and MySQL Router just went up from the 256 threads on.

Games 119
Insiders

Sign Up for our Newsletter

This site is protected by reCAPTCHA and the Google Privacy Policy and Terms of Service apply.

Trending Sources

article thumbnail

Synthetic Monitoring vs. RUM

Rigor

Let’s start with a brief definition of two of the more prominent web performance methodologies: synthetic monitoring and real user monitoring (also known as RUM). As a result, users can identify latency and downtime promptly, and they can then scientifically isolate and diagnose the root cause of any performance issues that may arise.

article thumbnail

A Complete Guide to Performance Budgets

Speed Curve

According to the Chrome dev team : "INP is a metric that aims to represent a page's overall interaction latency by selecting one of the single longest interactions that occur when a user visits a page. INP logs the latency of all interactions throughout the entire page lifecycle. Media sites are particularly prone to this issue.

article thumbnail

Fixing a slow site iteratively

CSS - Tricks

Google’s industry benchmarks from 2018 also provide a striking breakdown of how each second of loading affects bounce rates. Redirects are often pretty light in terms of the latency that they add to a website, but they are an easy first thing to check, and they can generally be removed with little effort.

Cache 92
article thumbnail

Kubernetes for Big Data Workloads

Abhishek Tiwari

A recent performance benchmark completed by Intel and BlueData using the BigBench benchmarking kit has shown that the performance ratios for container-based Hadoop workloads on BlueData EPIC are equal to and in some cases, better than bare-metal Hadoop [7]. Performance. Workload Characteristics and Candidates for Containerization ??.

article thumbnail

The Performance Inequality Gap, 2021

Alex Russell

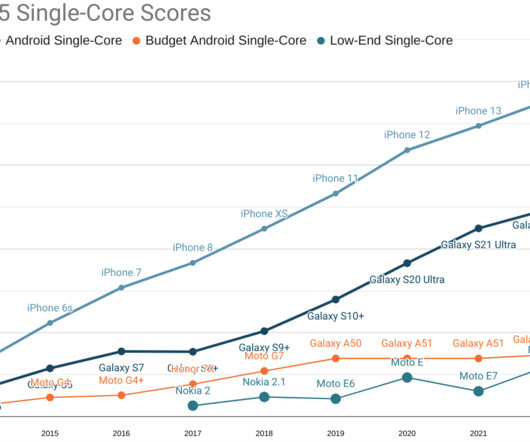
Using a global ASP as a benchmark can further mislead thanks to the distorting effect of ultra-high-end prices rising while shipment volumes stagnate. Sadly, data on latency is harder to get, even from Google's perch, so progress there is somewhat more difficult to judge. Today, either method returns a similar answer.