Remove Benchmarking Remove Data Remove Retail Remove Speed
article thumbnail

2023 Black Friday and Cyber Monday retail and e-commerce IT performance observations

Dynatrace

Over the years, I have watched and written about online retail and e-commerce IT performance. What I have seen is a maturing of the online retail channels when it comes to delivering customer experiences. This year we saw few, if any, major issues with online retailers. This is where many retailers have matured over the years.

Retail 217
article thumbnail

Introducing Page Speed Benchmarks – a new resource for the performance community

Speed Curve

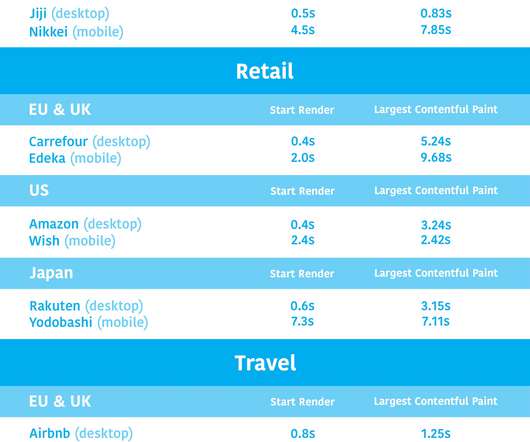
What are some good sites I can use for benchmarking? Page Speed Benchmarks is an interactive dashboard that lets you explore and compare web performance data for leading websites across several industries – from retail to media. Identify sites you can use for your own competitive benchmarking.

Insiders

Sign Up for our Newsletter

This site is protected by reCAPTCHA and the Google Privacy Policy and Terms of Service apply.

Trending Sources

article thumbnail

Industry page speed benchmarks (March 2022)

Speed Curve

Page Speed Benchmarks is an interactive dashboard that lets you explore and compare web performance data for leading websites across several industries – from retail to media – over the past year. Fastest Retail Sites. Create your own custom benchmark dashboard. United States. UK & EU.

article thumbnail

Five-nines availability: Always-on infrastructure delivers system availability during the holidays’ peak loads

Dynatrace

For retail organizations, peak traffic can be a mixed blessing. Five-nines availability: The ultimate benchmark of system availability. Cloud service providers, such as Amazon Web Services (AWS) , can offer infrastructure with five-nines availability by deploying in multiple availability zones and replicating data between regions.

article thumbnail

How to use Server Timing to get backend transparency from your CDN

Speed Curve

Looking at the industry benchmarks for US retailers , four well-known sites have backend times that are approaching – or well beyond – that threshold. Pagespeed Benchmarks - US Retail - LCP When you examine a waterfall, it's pretty obvious that TTFB is the long pole in the tent, pushing out render times for the page.

Servers 57
article thumbnail

Why you need to know your site's performance poverty line (and how to find it)

Speed Curve

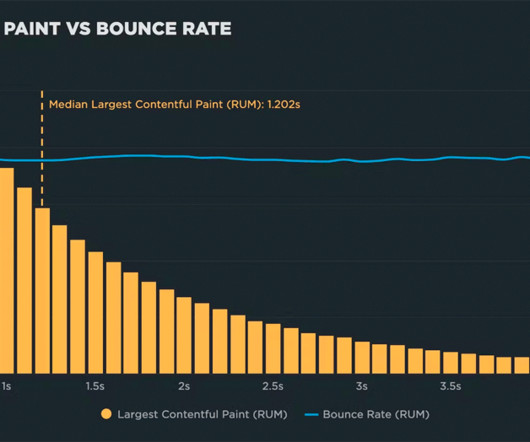
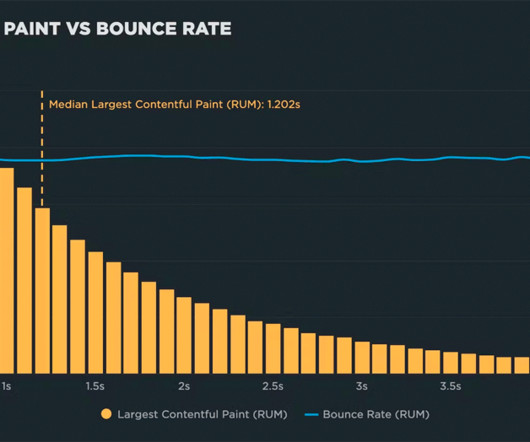
I coined this term more than ten years ago, when I was looking at data for a number of sites and noticed that – not only was there a correlation between performance metrics and business/engagement metrics – there was also a noticeable plateau in almost every correlation chart I looked at.

article thumbnail

2022 in review: New dashboards, Core Web Vitals enhancements, third-party tracking & more!

Speed Curve

Your Home dashboard brings together your Synthetic and RUM data to provide an easy-to-digest – and easy-to-share – snapshot of how your site is performing. Your current competitive benchmarks status. With your RUM Compare dashboard , you can easily generate side-by-side comparisons for any two cohorts of real user data.