Remove Benchmarking Remove Cache Remove Network Remove Servers
article thumbnail

How to use Server Timing to get backend transparency from your CDN

Speed Curve

Server-timing headers are a key tool in understanding what's happening within that black box of Time to First Byte (TTFB). Looking at the industry benchmarks for US retailers , four well-known sites have backend times that are approaching – or well beyond – that threshold.

Servers 57
article thumbnail

Crucial Redis Monitoring Metrics You Must Watch

Scalegrid

You will need to know which monitoring metrics for Redis to watch and a tool to monitor these critical server metrics to ensure its health. Evaluating factors like hit rate, which assesses cache efficiency level, or tracking key evictions from the cache are also essential elements during the Redis monitoring process.

Metrics 130
Insiders

Sign Up for our Newsletter

This site is protected by reCAPTCHA and the Google Privacy Policy and Terms of Service apply.

Trending Sources

article thumbnail

Measure What You Impact, Not What You Influence

CSS Wizardry

I can reload the exact same page under the exact same network conditions over and over, and I can guarantee I will not get the exact same, say, DOMContentLoaded each time. What if another file on the critical path had dropped out of cache and needed fetching from the network? In browserland, this is known Queuing.

article thumbnail

Five Data-Loading Patterns To Improve Frontend Performance

Smashing Magazine

The resource loading waterfall is a cascade of files downloaded from the network server to the client to load your website from start to finish. It essentially describes the lifetime of each file you download to load your page from the network. You can see this by opening your browser and looking in the Networking tab.

Cache 125
article thumbnail

How to Assess MySQL Performance

HammerDB

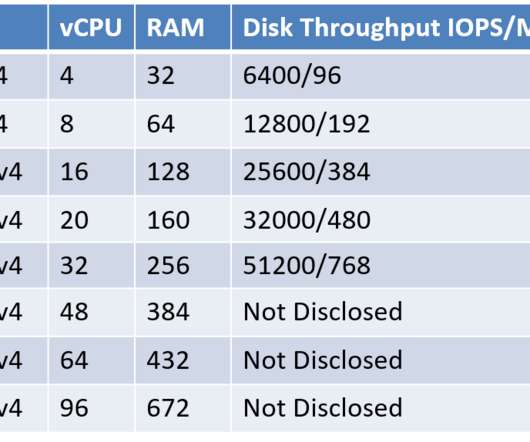
As database performance is heavily influenced by the performance of storage, network, memory, and processors, we must understand the upper limit of these key components. For the network, we can use Iperf to assess the network bandwidth between the client and the database server to ensure it will be enough to meet our peak requirement.

article thumbnail

MySQL Key Performance Indicators (KPI) With PMM

Percona

As a MySQL database administrator, keeping a close eye on the performance of your MySQL server is crucial to ensure optimal database operations. However, simply deploying a monitoring tool is not enough; you need to know which Key Performance Indicators (KPIs) to monitor to gain insights into your MySQL server’s health and performance.

article thumbnail

Redis vs Memcached in 2024

Scalegrid

Key Takeaways Redis offers complex data structures and additional features for versatile data handling, while Memcached excels in simplicity with a fast, multi-threaded architecture for basic caching needs. Redis is better suited for complex data models, and Memcached is better suited for high-throughput, string-based caching scenarios.

Cache 130