Remove Benchmarking Remove Best Practices Remove Cache Remove Servers
article thumbnail

Crucial Redis Monitoring Metrics You Must Watch

Scalegrid

You will need to know which monitoring metrics for Redis to watch and a tool to monitor these critical server metrics to ensure its health. Evaluating factors like hit rate, which assesses cache efficiency level, or tracking key evictions from the cache are also essential elements during the Redis monitoring process.

Metrics 130
article thumbnail

MySQL Key Performance Indicators (KPI) With PMM

Percona

As a MySQL database administrator, keeping a close eye on the performance of your MySQL server is crucial to ensure optimal database operations. However, simply deploying a monitoring tool is not enough; you need to know which Key Performance Indicators (KPIs) to monitor to gain insights into your MySQL server’s health and performance.

Insiders

Sign Up for our Newsletter

This site is protected by reCAPTCHA and the Google Privacy Policy and Terms of Service apply.

Trending Sources

article thumbnail

Percona Monitoring and Management 2 Scaling and Capacity Planning

Percona

Planning for resources of a PMM Server host instance can be tricky because the numbers can change depending on the DB instances being monitored by PMM. The VictoriaMetrics team has also published some best practices , which can also be referred to while planning for resources for setting up PMM2.

article thumbnail

Average Page Load Times for 2020 – Are you faster?

MachMetrics

How fast is the average time to first byte (server delay)? Google’s best practice is to have a speed index under 3 seconds. Google’s best practice is to be below 0.5 However, Google’s best practice is to keep the number of requests below 50, so there is still work to be done.

article thumbnail

MySQL Performance Tuning 101: Key Tips to Improve MySQL Database Performance

Percona

Reduced Resource Usage Optimizing resource-intensive queries and configurations can lead to a reduced burden on your server. An improperly configured server may not allocate sufficient resources or be optimized for the specific workload. Detecting and optimizing slow queries is an important step in enhancing database performance.

Tuning 52
article thumbnail

Google PageSpeed Insights - Scoring 100/100 with WordPress

KeyCDN

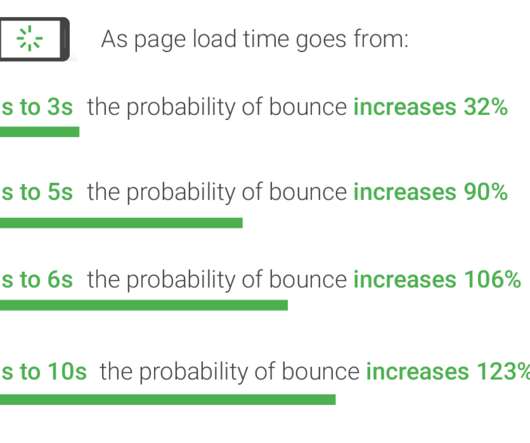
Take these statistics from Google’s industry benchmarks for mobile page speed guide: We’ve said it before but it’s worth reiterating that as web page load times increase, so does the likelihood of your visitors. According to Google, the best practice for a website’s speed is to keep it under 3 seconds load time.

Google 103
article thumbnail

PostgreSQL Performance Tuning: Optimizing Database Parameters for Maximum Efficiency

Percona

PostgreSQL performance optimization aims to improve the efficiency of a PostgreSQL database system by adjusting configurations and implementing best practices to identify and resolve bottlenecks, improve query speed, and maximize database throughput and responsiveness. What is PostgreSQL performance tuning?

Tuning 52