Remove Availability Remove Metrics Remove Retail Remove Video
article thumbnail

Element Timing: One true metric to rule them all?

Speed Curve

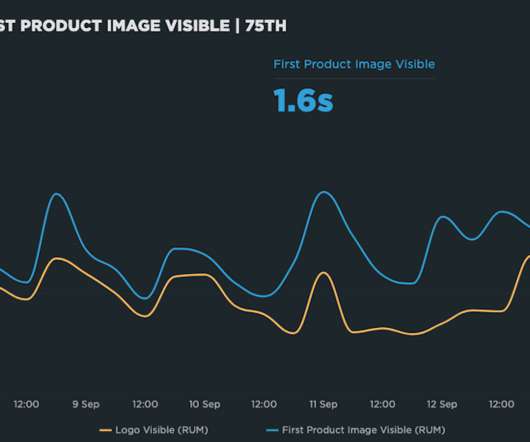
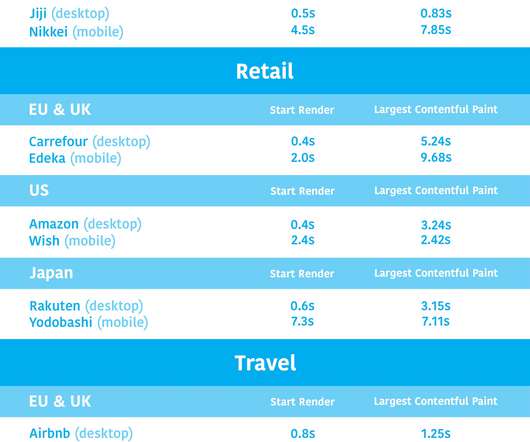
Largest Contentful Paint (LCP) measures when the largest visual element (image or video) finishes rendering. Element Timings can be collected in both Synthetic and RUM by configuring them in the Custom Metrics section of your settings: Adding a custom metric in SpeedCurve. Only available in Chromium-based browsers.

Metrics 141
article thumbnail

The value of business events: How IT can increase business agility

Dynatrace

Business events are prioritized over metric events and observability data to deliver lossless precision. Consider the following business revenue use case: A retail chain wants to boost the average checkout transaction value by encouraging customers to add additional items to their purchase. What are business events?

Analytics 224
Insiders

Sign Up for our Newsletter

This site is protected by reCAPTCHA and the Google Privacy Policy and Terms of Service apply.

Trending Sources

article thumbnail

Industry page speed benchmarks (March 2022)

Speed Curve

Page Speed Benchmarks is an interactive dashboard that lets you explore and compare web performance data for leading websites across several industries – from retail to media – over the past year. Key metrics. These visuals are a great tool for validating the best metrics to focus on for your pages. UK & EU.

article thumbnail

2022 in review: New dashboards, Core Web Vitals enhancements, third-party tracking & more!

Speed Curve

Jumped into in-person events, and were so happy to catch up with some of you at SmashingConf and performance.now() (You can watch videos of my talk about performance budgets and Andy Davies' talk about third parties.). You can see at a glance: Key metrics like Core Web Vitals and your User Happiness score. Home dashboard.

article thumbnail

Introducing Page Speed Benchmarks – a new resource for the performance community

Speed Curve

Here are some common questions I’m asked when I talk with people about performance: Which metrics should I care about? Page Speed Benchmarks is an interactive dashboard that lets you explore and compare web performance data for leading websites across several industries – from retail to media. How fast should I be?

article thumbnail

Performance audit: Lego.com

Speed Curve

We track LEGO.com, along with a handful of other leading ecommerce sites, in our public-facing Retail Benchmarks dashboard , which I encourage you to check out. LCP measures when the largest visual element in the viewport – typically a hero image or video – finishes rendering. seconds (which is a lot!)

article thumbnail

A Complete Guide to Performance Budgets

Speed Curve

A performance budget is a threshold that you apply to the metrics you care about the most. A good performance budget chart, such as the one above, should show you: The metric you're tracking The threshold you've created for that metric When you exceed that threshold How long you stayed out of bounds When you returned to below the threshold 3.