Remove Availability Remove Java Remove Traffic Remove Tuning
article thumbnail

Unlock end-to-end observability insights with Dynatrace PurePath 4 seamless integration of OpenTracing for Java

Dynatrace

Therefore, we’re happy to announce support for OpenTracing data that’s emitted by auto- and custom-instrumentation of Java source code with Dynatrace PurePath 4, our distributed tracing and code-level analysis technology. With Dynatrace OneAgent you also benefit from support for traffic routing and traffic control.

Java 230
article thumbnail

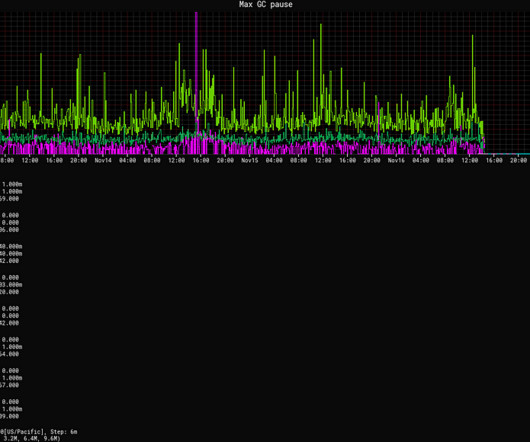
Bending pause times to your will with Generational ZGC

The Netflix TechBlog

If you’re interested in how we use Java at Netflix, Paul Bakker’s talk How Netflix Really Uses Java , is a great place to start. Each of these errors is a canceled request resulting in a retry so this reduction further reduces overall service traffic by this rate: Errors rates per second.

Latency 228
Insiders

Sign Up for our Newsletter

This site is protected by reCAPTCHA and the Google Privacy Policy and Terms of Service apply.

Trending Sources

article thumbnail

Dynatrace Application Security detects and blocks attacks automatically in real-time

Dynatrace

WAFs protect the network perimeter and monitor, filter, or block HTTP traffic. Compared to intrusion detection systems (IDS/IPS), WAFs are focused on the application traffic. RASP solutions sit in or near applications and analyze application behavior and traffic. How to get started.

Traffic 231
article thumbnail

Why PostgreSQL Is a Top Choice for Enterprise-level Databases

Percona

When it comes to enterprise-level databases, there are several options available in the market, but PostgreSQL stands out as one of the most popular and reliable choices. PostgreSQL supports sharding, which allows data to be distributed across multiple servers, making it ideal for high-traffic websites and applications.

Database 118
article thumbnail

Get out-of-the-box visibility into your ARM platform (Early Adopter)

Dynatrace

Other distributions like Debian and Fedora are available as well, in addition to other software like VMware, NGINX, Docker, and, of course, Java. OneAgent for the ARM platform comes with several deep-code monitoring modules: Java, NGINX, and Node.js. For details on available metrics, see host performance monitoring.

Java 132
article thumbnail

The road to observability demo part 3: Collect, instrument, and analyze telemetry data automatically with Dynatrace

Dynatrace

For that, we focused on OpenTelemetry as the underlying technology and showed how you can use the available SDKs and libraries to instrument applications across different languages and platforms. Here, we can find statistics on the overall availability of the database, connections, queries, and errors.

Metrics 168
article thumbnail

The Speed of Time

Brendan Gregg

Since instances of both CentOS and Ubuntu were running in parallel, I could collect flame graphs at the same time (same time-of-day traffic mix) and compare them side by side. There's no Java stack—there should be a tower of green Java methods—instead there's only a single green frame or two. us on Centos and 0.68

Speed 126