Remove Article Remove Benchmarking Remove Metrics Remove Retail
article thumbnail

How to use Server Timing to get backend transparency from your CDN

Speed Curve

However, that pesky 20% on the back end can have a big impact on downstream metrics like First Contentful Paint (FCP), Largest Contentful Paint (LCP), and any other 'loading' metric you can think of. Server-timing headers are a key tool in understanding what's happening within that black box of Time to First Byte (TTFB).

Servers 57
article thumbnail

Introducing Page Speed Benchmarks – a new resource for the performance community

Speed Curve

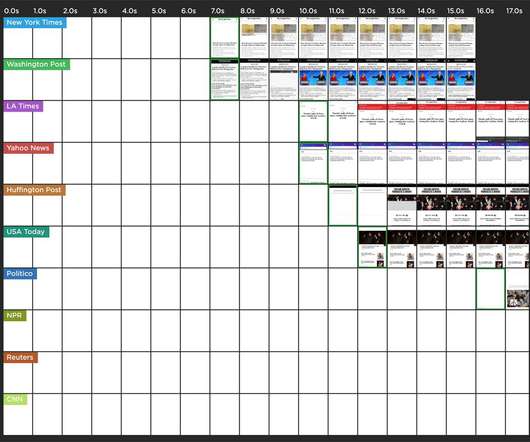
Here are some common questions I’m asked when I talk with people about performance: Which metrics should I care about? What are some good sites I can use for benchmarking? With Page Speed Benchmarks, you can do things like: See what the different metrics actually mean in terms of user-perceived performance.

Insiders

Sign Up for our Newsletter

This site is protected by reCAPTCHA and the Google Privacy Policy and Terms of Service apply.

Trending Sources

article thumbnail

Data Mining Problems in Retail

Highly Scalable

Retail is one of the most important business domains for data science and data mining applications because of its prolific data and numerous optimization problems such as optimal prices, discounts, recommendations, and stock levels that can be solved using data analysis methods. However, many of these models are highly parametric (i.e.

Retail 152
article thumbnail

World’s Top Web Performance Leaders To Watch

Rigor

Developers representing hundreds of companies work together at these meetups to become masters in performance metrics and the latest trends in measuring site speed.) Follow @ tameverts to stay updated on all her upcoming speaking engagements and articles. His articles for WebFundamentals are not to be missed. Scott Jehl.

article thumbnail

Ten years of page bloat: What have we learned?

Speed Curve

How does page bloat affect other metrics, such as Google's Core Web Vitals? And if that already wasn’t enough, the number of images on a page has been linked to lower conversion rates on retail sites. You can dive deeper into image optimization and SEO tips in this article in Google Search Central.). More on that later.).

Mobile 145
article thumbnail

2021 in review: It was a big year!

Speed Curve

We've been tracking these as individual metrics – Largest Contentful Paint, First Input Delay, and Cumulative Layout Shift – since before Google branded them as a set. Your Sessions dashboard lets you drill down and segment your RUM data by: Metric / duration. Web Performance for Retailers. RUM Live dashboard.

Retail 52
article thumbnail

A Complete Guide to Performance Budgets

Speed Curve

A performance budget is a threshold that you apply to the metrics you care about the most. A good performance budget chart, such as the one above, should show you: The metric you're tracking The threshold you've created for that metric When you exceed that threshold How long you stayed out of bounds When you returned to below the threshold 3.