Remove Architecture Remove Big Data Remove Event Remove Tuning
article thumbnail

What is IT automation?

Dynatrace

At its most basic, automating IT processes works by executing scripts or procedures either on a schedule or in response to particular events, such as checking a file into a code repository. When monitoring tools release a stream of alerts, teams can easily identify which ones are false and assess whether an event requires human intervention.

article thumbnail

Migrating Critical Traffic At Scale with No Downtime?—?Part 1

The Netflix TechBlog

Migrating Critical Traffic At Scale with No Downtime — Part 1 Shyam Gala , Javier Fernandez-Ivern , Anup Rokkam Pratap , Devang Shah Hundreds of millions of customers tune into Netflix every day, expecting an uninterrupted and immersive streaming experience. This technique facilitates validation on multiple fronts.

Traffic 339
Insiders

Sign Up for our Newsletter

This site is protected by reCAPTCHA and the Google Privacy Policy and Terms of Service apply.

Trending Sources

article thumbnail

Conducting log analysis with an observability platform and full data context

Dynatrace

Logs highlight observability challenges Ingesting, storing, and processing the unprecedented explosion of data from sources such as software as a service, multicloud environments, containers, and serverless architectures can be overwhelming for today’s organizations. Seamless integration. ” Watch session now!

Analytics 196
article thumbnail

Hyper Scale VPC Flow Logs enrichment to provide Network Insight

The Netflix TechBlog

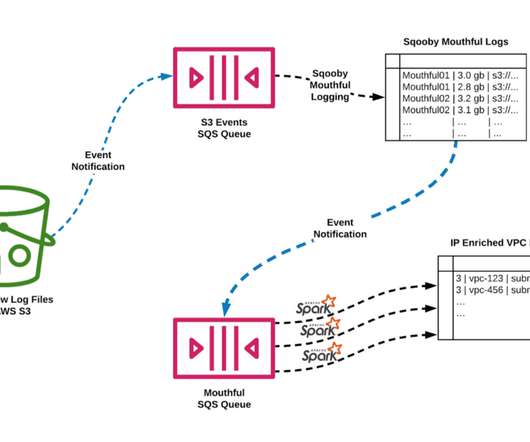
It is easier to tune a large Spark job for a consistent volume of data. As you may know, S3 can emit messages when events (such as a file creation events) occur which can be directed into an AWS SQS queue. In other words, we are able to ensure that our Spark app does not “eat” more data than it was tuned to handle.

Network 150
article thumbnail

Optimizing anomaly detection and noise

Dynatrace

In the fourth part of the series, I’ll show you how I used Dynatrace’s raw problem and event data to find the best fit for optimized anomaly detection settings. I took a big-data-analysis approach, which started with another problem visualization. Statistically analyzing Dynatrace’s event and problem data.

Tuning 264
article thumbnail

How Netflix uses eBPF flow logs at scale for network insight

The Netflix TechBlog

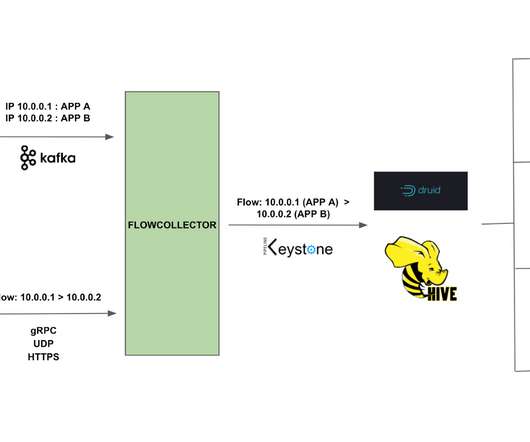
By collecting, accessing and analyzing network data from a variety of sources like VPC Flow Logs , ELB Access Logs, eBPF flow logs on the instances, etc, we can provide network insight to users and central teams through multiple data visualization techniques like Lumen , Atlas , etc. What is BPF?

Network 325
article thumbnail

Data lakehouse innovations advance the three pillars of observability for more collaborative analytics

Dynatrace

As teams try to gain insight into this data deluge, they have to balance the need for speed, data fidelity, and scale with capacity constraints and cost. To solve this problem, Dynatrace launched Grail, its causational data lakehouse , in 2022. Logs on Grail Log data is foundational for any IT analytics.

Analytics 195