Remove Analytics Remove Metrics Remove Scalability Remove Webinar
article thumbnail

Google Cloud Next 2024: AI innovation for Google Cloud

Dynatrace

As organizations continue to expand within cloud-native environments using Google Cloud, ensuring scalability becomes a top priority. Dynatrace offers essential analytics and automation to keep applications optimized and businesses flourishing. Learn to boost system reliability through proactive issue detection.

Google 254
article thumbnail

Expanded Grail data lakehouse and new Dynatrace user experience unlock boundless analytics

Dynatrace

Grail – the foundation of exploratory analytics Grail can already store and process log and business events. Now we’re adding Smartscape to DQL and two new data sources to Grail: Metrics on Grail and Traces on Grail. Grail solves this scalability issue! You no longer need to split, distribute, or pre-aggregate your data.

Analytics 222
Insiders

Sign Up for our Newsletter

This site is protected by reCAPTCHA and the Google Privacy Policy and Terms of Service apply.

Trending Sources

article thumbnail

What is observability? Not just logs, metrics and traces

Dynatrace

In IT and cloud computing, observability is the ability to measure a system’s current state based on the data it generates, such as logs, metrics, and traces. If you’ve read about observability, you likely know that collecting the measurements of logs, metrics, and distributed traces are the three key pillars to achieving success.

Metrics 363
article thumbnail

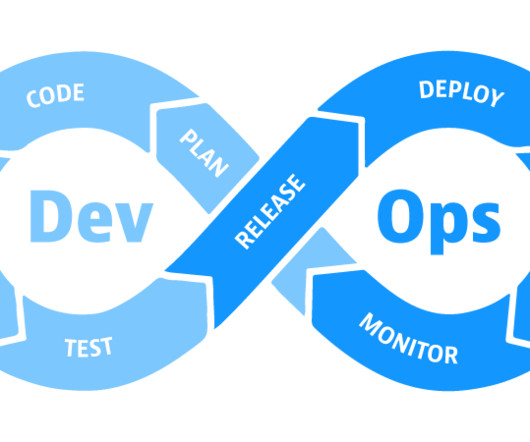
Boost DevOps maturity with observability and a data lakehouse

Dynatrace

They’re unleashing the power of cloud-based analytics on large data sets to unlock the insights they and the business need to make smarter decisions. From a technical perspective, however, cloud-based analytics can be challenging. That’s especially true of the DevOps teams who must drive digital-fueled sustainable growth.

DevOps 177
article thumbnail

What is log management? How to tame distributed cloud system complexities

Dynatrace

Metrics, logs , and traces make up three vital prongs of modern observability. Together with metrics, three sources of data help IT pros identify the presence and causes of performance problems, user experience issues, and potential security threats. Comparing log monitoring, log analytics, and log management.

Systems 180
article thumbnail

Dynatrace observability is now available for Red Hat OpenShift on the IBM® Power® architecture

Dynatrace

Captures metrics, traces, logs, and other telemetry data in context. Smartscape topology mapping: Dynatrace uses its Smartscape technology to semantically map metrics, traces, logs, and real user data to specific Kubernetes objects, including containers, pods, nodes, and services. Check out this webinar. New to Dynatrace?

article thumbnail

Dynatrace AppEngine: Everything thinkable is now possible

Dynatrace

Not only are these approaches difficult and costly to maintain, they also lack proper security and scalability. App developers have the same limitless possibilities for creating customized analytics and integrations in any IT environment, whether in the cloud or on-premises.