Remove 2020 Remove Blog Remove Metrics Remove Operating System
article thumbnail

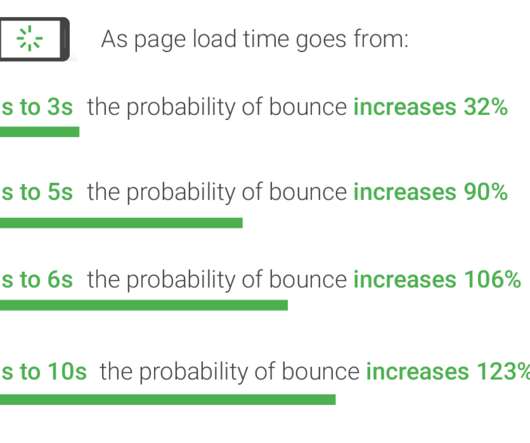
Average Page Load Times for 2020 – Are you faster?

MachMetrics

With another year winding down, it’s time for us to take stock of how our site performance compares to the average page load times for 2020. Similar to our article Average Page Load Times for 2018 , we’ll go over the averages for metrics and help you determine if your site is faster or slower than average.

article thumbnail

What is OpenShift and why automation matters

Dynatrace

It offers automated installation, upgrades, and lifecycle management throughout the container stack – the operating system, Kubernetes and cluster services, and applications – on any cloud. Automation has become a major trend during 2020. The post What is OpenShift and why automation matters appeared first on Dynatrace blog.

Cloud 256
Insiders

Sign Up for our Newsletter

This site is protected by reCAPTCHA and the Google Privacy Policy and Terms of Service apply.

Trending Sources

article thumbnail

OneAgent release notes version 1.199

Dynatrace

Rollout start 24 August 2020. Operating systems. Upcoming Operating systems support changes. The following operating systems will no longer be supported starting 01 November 2020. The following operating systems will no longer be supported starting 01 December 2020.

Java 103
article thumbnail

OneAgent release notes version 1.207

Dynatrace

Rollout starts 15 December 2020. Upcoming Operating systems support changes. The following operating systems will no longer be supported starting 01 February 2021. The following operating systems will no longer be supported starting 01 May 2021. Dynatrace news. Dynatrace ONE Premium. UNIX: IBM AIX 7.2

article thumbnail

Percona Is Introducing Telemetry Mechanisms Into MySQL, PostgreSQL, and MongoDB

Percona

Back in 2020, we set out to learn more about how Percona Monitoring and Management (PMM) was being used in order to provide a better product to the community. This blog post already comes with some of such data (breakdown of MySQL versions we observed via PMM over the last six months; please see above).

article thumbnail

Kubernetes: Challenges for observability platforms

Dynatrace

metrics, traces, and logs) to gain a better understanding of the behavior of their code during runtime. Metrics are a numeric representation of intervals over time. They can help you find out how the behavior of a system changes over time (for example, how long do requests take in the new version compared to the last version?).

article thumbnail

Automate complex metric-related use cases with the Metrics API version 2

Dynatrace

Dynatrace collects a huge number of metrics for each OneAgent-monitored host in your environment. Depending on the types of technologies you’re running on individual hosts, the average number of metrics is about 500 per computational node. Running metric queries on a subset of entities for live monitoring and system overviews.

Metrics 220