Remove 2019 Remove Latency Remove Monitoring
article thumbnail

Site reliability done right: 5 SRE best practices that deliver on business objectives

Dynatrace

The practice uses continuous monitoring and high levels of automation in close collaboration with agile development teams to ensure applications are highly available and perform without friction. At the lowest level, SLIs provide a view of service availability, latency, performance, and capacity across systems.

article thumbnail

Netflix at AWS re:Invent 2019

The Netflix TechBlog

Netflix runs dozens of stateful services on AWS under strict sub-millisecond tail-latency requirements, which brings unique challenges. We showcase our case studies, open-source tools in benchmarking, and how we ensure that AWS cloud services are serving our needs without compromising on tail latencies. Thursday?—?December

AWS 100
Insiders

Sign Up for our Newsletter

This site is protected by reCAPTCHA and the Google Privacy Policy and Terms of Service apply.

article thumbnail

Netflix at AWS re:Invent 2019

The Netflix TechBlog

Netflix runs dozens of stateful services on AWS under strict sub-millisecond tail-latency requirements, which brings unique challenges. We showcase our case studies, open-source tools in benchmarking, and how we ensure that AWS cloud services are serving our needs without compromising on tail latencies. Thursday?—?December

AWS 100
article thumbnail

Netflix at AWS re:Invent 2019

The Netflix TechBlog

In 2019, Netflix moved thousands of container hosts to bare metal. Netflix runs dozens of stateful services on AWS under strict sub-millisecond tail-latency requirements, which brings unique challenges. By watching applications for anomalous actions, security and operations teams can monitor unusual and erroneous behavior.

AWS 38
article thumbnail

Building Netflix’s Distributed Tracing Infrastructure

The Netflix TechBlog

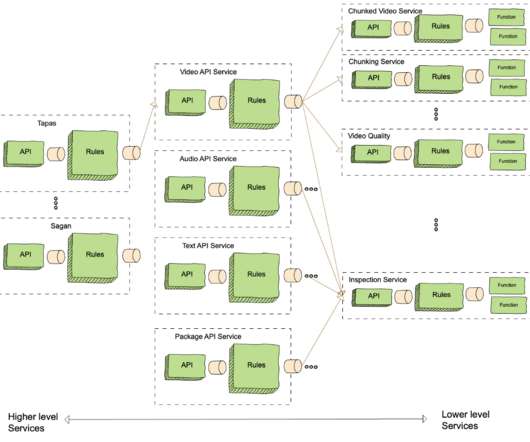
If we had an ID for each streaming session then distributed tracing could easily reconstruct session failure by providing service topology, retry and error tags, and latency measurements for all service calls. Additionally, it became easy to provide deep links to different monitoring and deployment systems in Edgar due to consistent tagging.

article thumbnail

Understanding operational 5G: a first measurement study on its coverage, performance and energy consumption

The Morning Paper

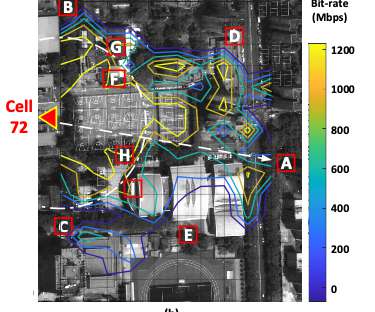
We are standing on the eve of the 5G era… 5G, as a monumental shift in cellular communication technology, holds tremendous potential for spurring innovations across many vertical industries, with its promised multi-Gbps speed, sub-10 ms low latency, and massive connectivity. Throughput and latency. km university campus.

Energy 130
article thumbnail

Analyzing a High Rate of Paging

Brendan Gregg

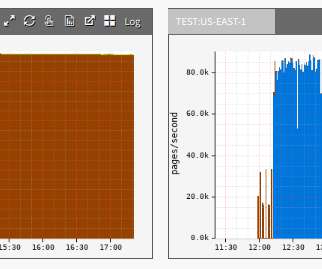
A cloud-wide monitoring tool, Atlas, showed a high rate of paging for the larger file uploads: The blue is pageins (page ins). biolatency From [bcc], this eBPF tool shows a latency histogram of disk I/O. The problem was that large files, such as 100 Gbytes, seemed to take forever to upload. Tracing block device I/O.

Cache 86