Remove Metrics Remove Presentation Remove Retail Remove Storage
article thumbnail

Dynatrace and Red Hat expand enterprise observability to edge computing

Dynatrace

As an example, many retailers already leverage containerized workloads in-store to enhance customer experiences using video analytics or streamline inventory management using RFID tracking for improved security. Observability on edge devices presents unique challenges compared to traditional data-center or cloud-based environments.


Retail 254
article thumbnail

What is log analytics? How a modern observability approach provides critical business insight

Dynatrace

It’s also common for teams, as part of their log monitoring practice, to write business metrics to a log that can then be tracked on a dashboard or trigger an alert. At the same time, log analytics can present challenges as data volumes explode, particularly in traditional environments that lack end-to-end observability solutions.

Analytics 211
Insiders

Sign Up for our Newsletter

This site is protected by reCAPTCHA and the Google Privacy Policy and Terms of Service apply.

Trending Sources

article thumbnail

What is log analytics? How a modern observability approach provides critical business insight

Dynatrace

It’s also common for teams, as part of their log monitoring practice, to write business metrics to a log that can then be tracked on a dashboard or trigger an alert. At the same time, log analytics can present challenges as data volumes explode, particularly in traditional environments that lack end-to-end observability solutions.

Analytics 178
article thumbnail

Kubernetes in the wild report 2023

Dynatrace

The immense growth of Kubernetes presents new security challenges in runtime and increased complexity in hardening CI/CD pipelines in development. In general, metrics collectors and providers are most common, followed by log and tracing projects. Note: The survey excluded all commercial observability offerings, including Dynatrace.

article thumbnail

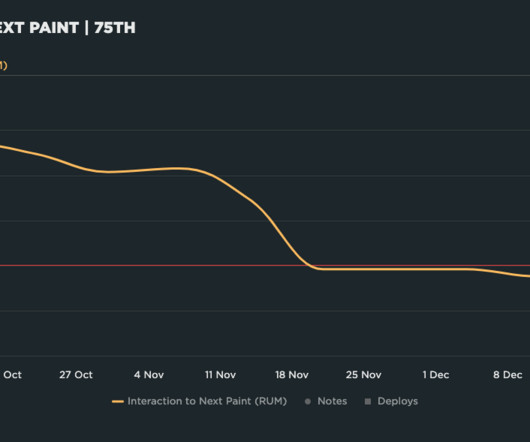
Debugging Interaction to Next Paint (INP)

Speed Curve

Heatmap of the most popular pages and their Web Vitals metrics I then typically switch to the RUM > Design dashboard and use the list of popular interaction elements to determine which ones I want to investigate further. Guest profiles also start with empty caches, empty cookie stores, empty browser storage, etc.

article thumbnail

Quality Begins Where the User Journey Ends

Apica

A typical user journey would include all the actions in a typical human user’s session using a website or application – the screens they are presented with, what objects they click on, and what screens and data payloads are returned. Metrics and observability data hoarding. and getting pricing estimates from all of these parties.

Retail 52