Remove Latency Remove Operating System Remove Software Remove Tuning
article thumbnail

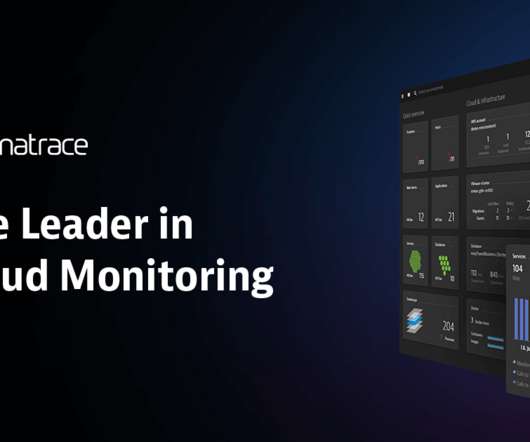
Enhancing Kubernetes cluster management key to platform engineering success

Dynatrace

As organizations continue to modernize their technology stacks, many turn to Kubernetes , an open source container orchestration system for automating software deployment, scaling, and management. You can ask for the best configuration to reduce latency or improve the user experience.”

article thumbnail

Crucial Redis Monitoring Metrics You Must Watch

Scalegrid

Key Takeaways Critical performance indicators such as latency, CPU usage, memory utilization, hit rate, and number of connected clients/slaves/evictions must be monitored to maintain Redis’s high throughput and low latency capabilities. It can achieve impressive performance, handling up to 50 million operations per second.

Metrics 130
Insiders

Sign Up for our Newsletter

This site is protected by reCAPTCHA and the Google Privacy Policy and Terms of Service apply.

Trending Sources

article thumbnail

What is serverless computing? Driving efficiency without sacrificing observability

Dynatrace

Traditional computing models rely on virtual or physical machines, where each instance includes a complete operating system, CPU cycles, and memory. There is no need to plan for extra resources, update operating systems, or install frameworks. The provider is essentially your system administrator.

article thumbnail

Faster time to value with enhanced handling of OneAgent runtime data

Dynatrace

This is why the Dynatrace Software Intelligence Platform is recognized as a market leader not only for monitoring coverage, but also, very importantly, for providing the shortest time-to-value. Operating Systems are not always set up in the same way. Stay tuned for upcoming news about these changes. See details below.

Storage 146
article thumbnail

How digital experience monitoring helps deliver business observability

Dynatrace

STM generates traffic that replicates the typical path or behavior of a user on a network to measure performance for example, response times, availability, packet loss, latency, jitter, and other variables). One use case for STM is to model the behavior of a customer in the form of a flow of transactions along the buyer’s journey.

article thumbnail

Software-defined far memory in warehouse scale computers

The Morning Paper

Software-defined far memory in warehouse-scale computers Lagar-Cavilla et al., ” This paper describes a “far memory” system that has been in production deployment at Google since 2016. .” ” This paper describes a “far memory” system that has been in production deployment at Google since 2016.

article thumbnail

The road to observability demo part 3: Collect, instrument, and analyze telemetry data automatically with Dynatrace

Dynatrace

Making applications observable—relying on metrics, logs, and traces to understand what software is doing and how it’s performing—has become increasingly important as workloads are shifting to multicloud environments. DNS query time indicates the average response times of DNS requests across the system.

Metrics 168