Remove Google Remove Metrics Remove Open Source Remove Testing Tools
article thumbnail

Google Lighthouse Audits – How to use Chrome’s built-in speed testing tool

MachMetrics

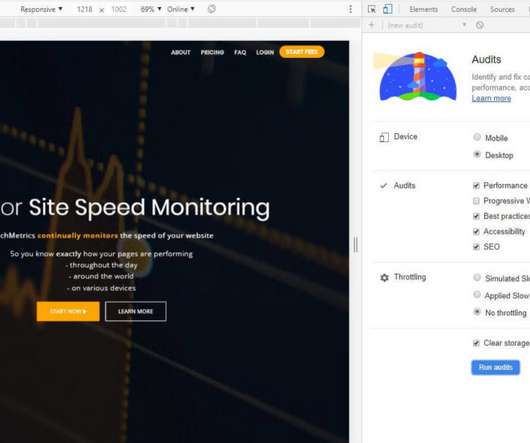
If you’re not a developer/designer, you may not be familiar with the Chrome DevTools and the extremely powerful Google Lighthouse Audits that can be found inside. However, you have likely used the Web UI that Google uses to allow you to test websites for speed – Google PageSpeed Insights. Performance.

Google 82
article thumbnail

Performance Testing - Tools, Steps, and Best Practices

KeyCDN

Before you begin tuning your website or application, you must first figure out which metrics matter most to your users and establish some achievable benchmarks. What is Performance Testing? For example, you can use load testing tools to see how your application performs with a certain number of simultaneous users.

Insiders

Sign Up for our Newsletter

This site is protected by reCAPTCHA and the Google Privacy Policy and Terms of Service apply.

Trending Sources

article thumbnail

A guide to event-driven SRE-inspired DevOps

Dynatrace

“This is a mouthful of buzzwords” is how I started my recent presentations at the Online Kubernetes Meetup as well as the DevOps Fusion 2020 Online Conference when explaining the three big challenges we are trying to solve with Keptn – our CNCF Open Source project: Automate build validation through SLI/SLO-based Quality Gates.

DevOps 246
article thumbnail

An Opinionated Guide to Performance Budgets

Speed Curve

Web pages are unbelievably complex, and there are hundreds of different metrics available to track. A performance budget is a threshold that you apply to the metrics you care about the most. This is when you run into three important questions: Which metrics should you focus on? Which metrics should you focus on?

article thumbnail

Release readiness through AI-based white box resiliency testing with JMeter and Dynatrace

Dynatrace

Our solution to modernize this legacy approach is an approach we call white box testing. In white-box testing, we combine open-source load testing tools such as JMeter with Dynatrace’s observability and analytics capabilities. from other test tools or real users).

Testing 218
article thumbnail

Tutorial: Guide to automated SRE-driven performance engineering

Dynatrace

You may have seen over the past few months we have been extensively promoting Service Level Indicators (SLIs) and Service Level Objectives (SLOs) as part of our Open Source project Keptn. Once our application under test is properly tagged we can use tags for filtering. Step #4: Tag your Load Testing steps.

article thumbnail

Automated Deployment and Architectural Validation with Pitometer and keptn!

Dynatrace

At Neotys PAC 2019 in Chamonix, France, I presented approaches on how to solve this problem by looking at examples from companies such as Intuit, Dynatrace, Google, Netflix, T-Systems and others. Introducing Pitometer: Metrics-based Deployment Validation in your CI/CD. When executing the validation, Pitometer. 1: Pitometer in keptn.