Wed.Sep 21, 2022

article thumbnail

Bad Performance and/or Structure Scores: Hosting or Developer?

Gtmetrix

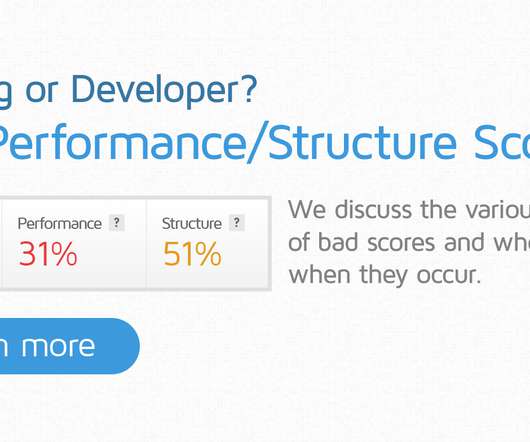
Seeing poor Performance and/or Structure Scores on your GTmetrix Report? We’ll tell you if you need to consult your hosting provider or developer. Overview GTmetrix is primarily used to assess front-end issues though it can detect potential back-end issues as well. In this article, we discuss whether bad Performance and/or Structure Scores could be […].

article thumbnail

Native vs. Cross Platform: Decoding Best Choice for Your App Development

Simform

Native applications benefit the operating system's features and development environment. On the contrary, cross-platform apps help reduce time to market and costs. So, which one to choose? We have compared both for different aspects of application development to help you choose between native vs. cross-platform.

Insiders

Sign Up for our Newsletter

This site is protected by reCAPTCHA and the Google Privacy Policy and Terms of Service apply.

Trending Sources

article thumbnail

New Bit Manipulation Functions in SQL Server 2022

SQL Performance

The need to manipulate data at the bit level with bitwise operations isn’t common in T-SQL, but you might stumble into such a need in some specialized scenarios. Some implementations store a set of flags (yes/no, on/off, true/false) in a single integer or binary-typed column, where each bit represents a different flag. One example is using a bitwise representation of a set of user/role permissions.

Servers 122
article thumbnail

Why digital transformation hinges on SRE teams

Dynatrace

Site reliability engineering seeks to bridge the gap between developers and operations teams, embedding reliability and resiliency into each stage of the software development lifecycle. Site reliability engineering (SRE) is a key component of digital transformation. Still, many organizations have found that the transition to SRE maturity is not always easy.

article thumbnail

Announcing the release of pg_stat_monitor 1.1.0

Percona Community

Percona is happy to announce the 1.1.0 release of pg_stat_monitor. You can install it from the Percona repositories following the installation instructions. pg_stat_monitor is a Query Performance Monitoring tool for PostgreSQL. It attempts to provide a more holistic picture by providing much-needed query performance insights in a single view. pg_stat_monitor provides improved insights that allow database users to understand query origins, execution, planning statistics and details, query informa

Tuning 52