article thumbnail

Black Friday traffic exposes gaps in observability strategies

Dynatrace

What’s the problem with Black Friday traffic? If the mantra in sales is “Always be closing,” the mantra for online retail storefronts is “Always be online.”. in 2020, ecommerce grew 14.2% in 2021. Why Black Friday traffic threatens customer experience. Dynatrace news. In the U.S.,

Traffic 185
article thumbnail

Five questions with Forrester Analyst: The state of the UK Retail landscape

Dynatrace

For retail, in particular, the crisis has forced many to accelerate the execution of strategic plans for digital customer experience and operational excellence. Consumers may be more likely to interact more “digitally” with brands going forward, and online sales are expected to make up a greater proportion of overall retail sales.

Retail 182
Insiders

Sign Up for our Newsletter

This site is protected by reCAPTCHA and the Google Privacy Policy and Terms of Service apply.

Trending Sources

article thumbnail

COVID-19 and Digital Services: An Action Plan for the Unexpected

Dynatrace

While most government agencies and commercial enterprises have digital services in place, the current volume of usage — including traffic to critical employment, health and retail/eCommerce services — has reached levels that many organizations have never seen before or tested against. So how do you know what to prepare for?

Traffic 203
article thumbnail

Why you need to know your site's performance poverty line (and how to find it)

Speed Curve

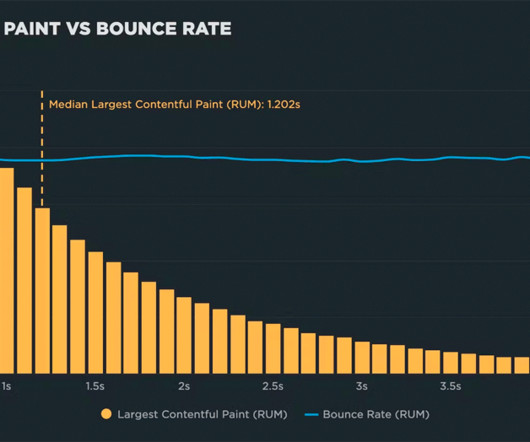
Background For this new investigation, I selected four sites that experience a significant amount of user traffic. If you have access to other data sources, then you can create a variety of correlation charts, If run an ecommerce site, then you can measure revenue, cart size, and conversion rate.

article thumbnail

Why you need to know your site's performance plateau (and how to find it)

Speed Curve

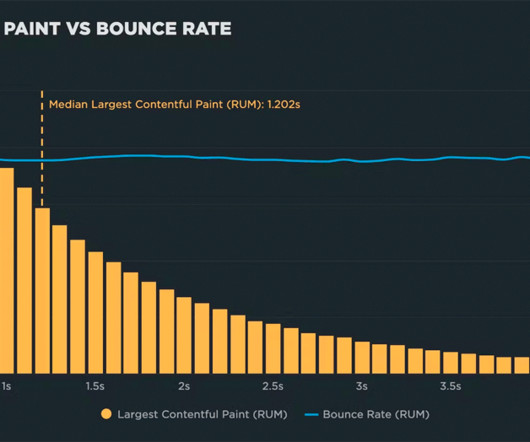
Background For this new investigation, I selected four sites that experience a significant amount of user traffic. If you have access to other data sources, then you can create a variety of correlation charts, If run an ecommerce site, then you can measure revenue, cart size, and conversion rate.