Remove Best Practices Remove Metrics Remove Speed Remove Testing Tools
article thumbnail

What is continuous delivery and what are best practices for implementing it?

Dynatrace

Every CD pipeline is unique to the organization it serves, and varies according to architectures, computing environments, tool sets, and corporate, industry, and regulatory requirements. Here are a few common metrics teams should track for every CD pipeline to help you evaluate its efficacy. Develop Service Level Objectives (SLOs).

article thumbnail

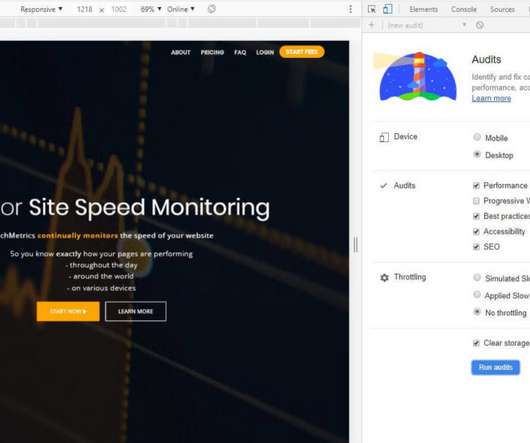
Google Lighthouse Audits – How to use Chrome’s built-in speed testing tool

MachMetrics

However, you have likely used the Web UI that Google uses to allow you to test websites for speed – Google PageSpeed Insights. Lighthouse is a completely open-source tool that allows users to test any website in a multitude of ways. Let’s take a look at how to get the most out of this powerful tool.

Google 82
Insiders

Sign Up for our Newsletter

This site is protected by reCAPTCHA and the Google Privacy Policy and Terms of Service apply.

Trending Sources

article thumbnail

What is synthetic testing?

Dynatrace

Also called continuous monitoring or synthetic monitoring , synthetic testing mimics actual users’ behaviors to help companies identify and remediate potential availability and performance issues. At a minimum, a synthetic monitoring program should include the following tools: Single-URL browser monitors.

Testing 204
article thumbnail

Performance Testing - Tools, Steps, and Best Practices

KeyCDN

Before you begin tuning your website or application, you must first figure out which metrics matter most to your users and establish some achievable benchmarks. What is Performance Testing? When the word “performance” is heard, most people immediately think of speed. Which Web Performance Metrics Matter?

article thumbnail

Release readiness through AI-based white box resiliency testing with JMeter and Dynatrace

Dynatrace

Our solution to modernize this legacy approach is an approach we call white box testing. In white-box testing, we combine open-source load testing tools such as JMeter with Dynatrace’s observability and analytics capabilities. from other test tools or real users). Leveraging the W3C Trace context header.

Testing 214
article thumbnail

Tutorial: Guide to automated SRE-driven performance engineering

Dynatrace

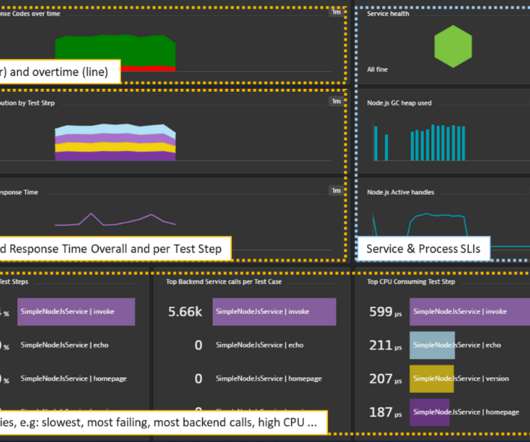
Let me walk you through how I have built my Dynatrace Performance Insights Dashboard showing SLIs split by Test Name as well as SLIs for the specific technology and infrastructure: Enriching your load testing scripts with meta data allows building test context specific SLI-dashboards in Dynatrace.

article thumbnail

An Opinionated Guide to Performance Budgets

Speed Curve

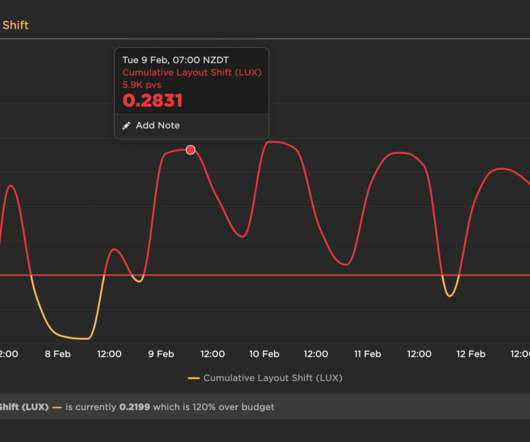
Web pages are unbelievably complex, and there are hundreds of different metrics available to track. A performance budget is a threshold that you apply to the metrics you care about the most. This is when you run into three important questions: Which metrics should you focus on? Which metrics should you focus on?