Remove Benchmarking Remove Processing Remove Retail Remove Speed
article thumbnail

2023 Black Friday and Cyber Monday retail and e-commerce IT performance observations

Dynatrace

Over the years, I have watched and written about online retail and e-commerce IT performance. What I have seen is a maturing of the online retail channels when it comes to delivering customer experiences. This year we saw few, if any, major issues with online retailers. This is where many retailers have matured over the years.

Retail 217
article thumbnail

Five-nines availability: Always-on infrastructure delivers system availability during the holidays’ peak loads

Dynatrace

For retail organizations, peak traffic can be a mixed blessing. Five-nines availability: The ultimate benchmark of system availability. Complicating the situation further, increasingly connected services are pushing more data processing to the edge. While high-volume traffic often boosts sales, it can also compromise uptimes.

Insiders

Sign Up for our Newsletter

This site is protected by reCAPTCHA and the Google Privacy Policy and Terms of Service apply.

Trending Sources

article thumbnail

How to use Server Timing to get backend transparency from your CDN

Speed Curve

Looking at the industry benchmarks for US retailers , four well-known sites have backend times that are approaching – or well beyond – that threshold. Pagespeed Benchmarks - US Retail - LCP When you examine a waterfall, it's pretty obvious that TTFB is the long pole in the tent, pushing out render times for the page.

Servers 57
article thumbnail

eCommerce & Retail: There’s No Excuse to Ignore Performance

Rigor

Whether it be time, money, or technical know how, every day we talk to eCommerce and Retail teams who explain why they aren’t monitoring their site’s performance. Since our team is preparing for eTail West , there is no better time to address some of the common objections I’ve seen when talking to eCommerce and Retail teams about performance.

article thumbnail

Why you need to know your site's performance poverty line (and how to find it)

Speed Curve

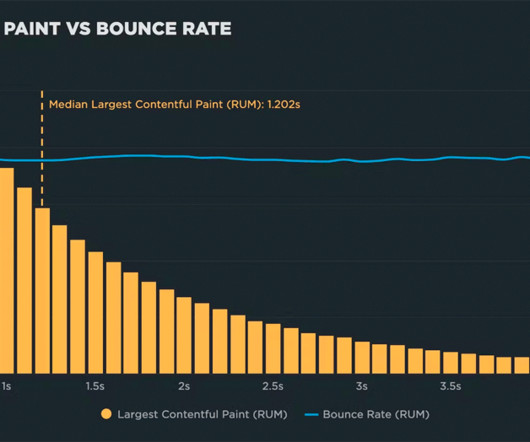
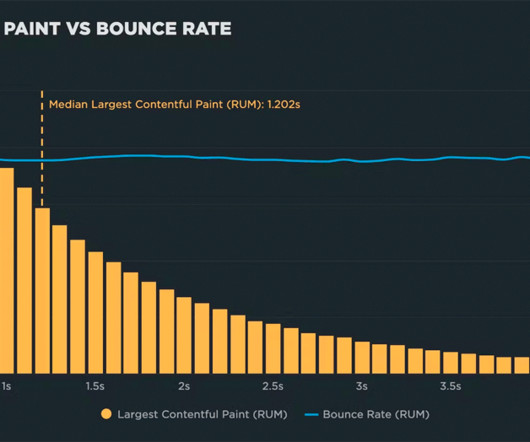
Poverty lines emerged for both Start Render and Largest Contentful Paint I expected the results for Start Render, as it's been around as a page speed metric for many years, and has been proven to correlate to business metrics. The blue bar represents the change in bounce rate across all cohorts. You need to look at your own real user data. (If

article thumbnail

Stuff The Internet Says On Scalability For September 7th, 2018

High Scalability

Retail: $20 trillion. We fairly frequently see performance get 5% or more worse over time in a single process execution. 5% might not sound like much, but it’s a huge figure when you consider that many VM optimisations aim to speed things up by 1% at most. They'll love you even more. Cars: $1 trillion.

Internet 137
article thumbnail

Ten years of page bloat: What have we learned?

Speed Curve

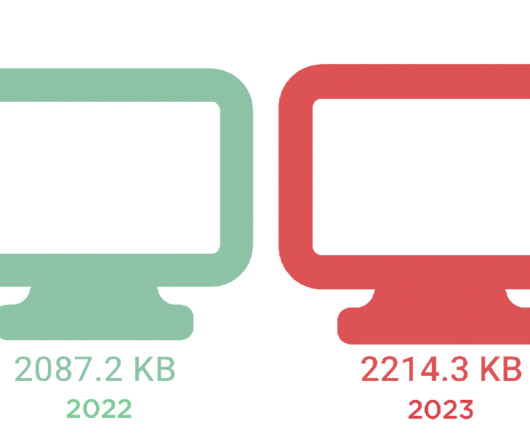
And if that already wasn’t enough, the number of images on a page has been linked to lower conversion rates on retail sites. These numbers should not be taken as a benchmark for your own site. JavaScript is a massive CPU hog, so this is concerning, especially if your users are on older devices with less processing power. (If

Mobile 145