Remove Benchmarking Remove Monitoring Remove Retail Remove Speed
article thumbnail

2023 Black Friday and Cyber Monday retail and e-commerce IT performance observations

Dynatrace

Over the years, I have watched and written about online retail and e-commerce IT performance. What I have seen is a maturing of the online retail channels when it comes to delivering customer experiences. This year we saw few, if any, major issues with online retailers. This is where many retailers have matured over the years.

Retail 220
article thumbnail

Five-nines availability: Always-on infrastructure delivers system availability during the holidays’ peak loads

Dynatrace

For retail organizations, peak traffic can be a mixed blessing. Five-nines availability: The ultimate benchmark of system availability. Instead, to speed up response times, applications are now processing most data at the network’s perimeter, closest to the data’s origin. But is five nines availability attainable?

Insiders

Sign Up for our Newsletter

This site is protected by reCAPTCHA and the Google Privacy Policy and Terms of Service apply.

Trending Sources

article thumbnail

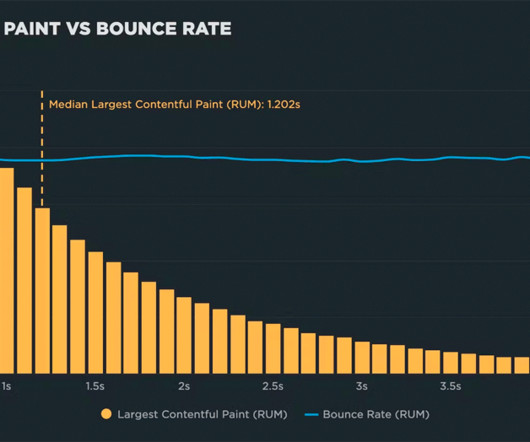
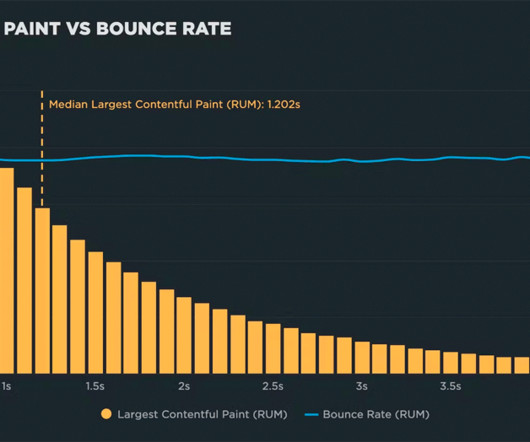
Why you need to know your site's performance poverty line (and how to find it)

Speed Curve

For each site, I used a month's worth of RUM (real user monitoring) data to generate correlation charts. Poverty lines emerged for both Start Render and Largest Contentful Paint I expected the results for Start Render, as it's been around as a page speed metric for many years, and has been proven to correlate to business metrics.

article thumbnail

eCommerce & Retail: There’s No Excuse to Ignore Performance

Rigor

Whether it be time, money, or technical know how, every day we talk to eCommerce and Retail teams who explain why they aren’t monitoring their site’s performance. You don’t have the time to monitor something that affects your company’s revenue and almost every online metric your business cares about ? Conclusion.

article thumbnail

2022 in review: New dashboards, Core Web Vitals enhancements, third-party tracking & more!

Speed Curve

Your current competitive benchmarks status. Hint: If you're considering installing a big-screen performance monitor at your organization, this dashboard is a good candidate for that.). Expanded Industry Speed Benchmarks. The current status of your performance budgets. Synthetic Site dashboard. Lots of new videos!

article thumbnail

Ten years of page bloat: What have we learned?

Speed Curve

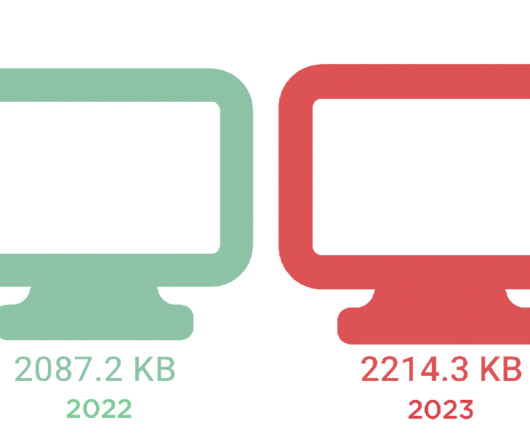
And if that already wasn’t enough, the number of images on a page has been linked to lower conversion rates on retail sites. These numbers should not be taken as a benchmark for your own site. You can see this by looking at the synthetic test result for Sears.com (again, available via our Industry Benchmarks ).

Mobile 145
article thumbnail

2021 in review: It was a big year!

Speed Curve

If you want to understand how people actually experience your site, then you need to monitor real users. We also added a "Performance 101" section that includes articles like: Synthetic vs. Real User Monitoring. Web Performance for Retailers. Industry speed benchmarks for Japan. Visibility is the first step!

Retail 52