Remove Benchmarking Remove Metrics Remove Retail Remove Testing
article thumbnail

Industry page speed benchmarks (March 2022)

Speed Curve

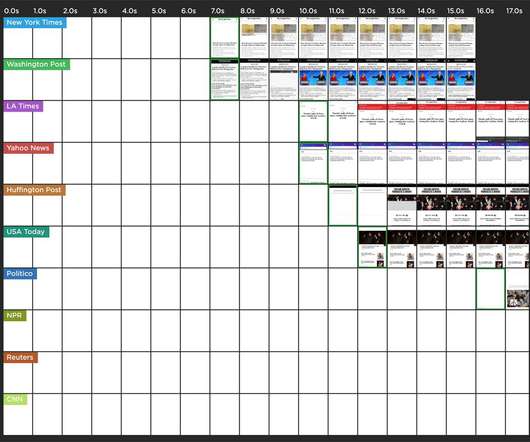
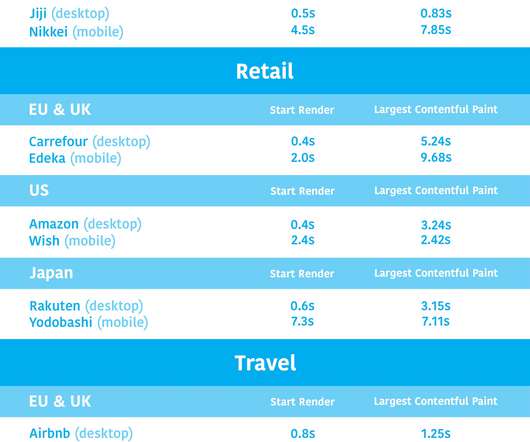
Page Speed Benchmarks is an interactive dashboard that lets you explore and compare web performance data for leading websites across several industries – from retail to media – over the past year. Scroll down to the bottom of this post for more testing details.). Key metrics. Fastest Retail Sites.

article thumbnail

eCommerce & Retail: There’s No Excuse to Ignore Performance

Rigor

Whether it be time, money, or technical know how, every day we talk to eCommerce and Retail teams who explain why they aren’t monitoring their site’s performance. Since our team is preparing for eTail West , there is no better time to address some of the common objections I’ve seen when talking to eCommerce and Retail teams about performance.

Insiders

Sign Up for our Newsletter

This site is protected by reCAPTCHA and the Google Privacy Policy and Terms of Service apply.

Trending Sources

article thumbnail

Performance audit: Lego.com

Speed Curve

Background For this performance audit, I looked at this synthetic test for the LEGO.com home page. (We We track LEGO.com, along with a handful of other leading ecommerce sites, in our public-facing Retail Benchmarks dashboard , which I encourage you to check out. Let's dig deeper. seconds, LCP lags at 3.96

article thumbnail

2022 in review: New dashboards, Core Web Vitals enhancements, third-party tracking & more!

Speed Curve

Expanded our test agent locations to bring you even more places to test from worldwide. You can see at a glance: Key metrics like Core Web Vitals and your User Happiness score. Your current competitive benchmarks status. As you may already know, we run full Lighthouse audits on every page you test in synthetic.

article thumbnail

An Opinionated Guide to Performance Budgets

Speed Curve

Web pages are unbelievably complex, and there are hundreds of different metrics available to track. A performance budget is a threshold that you apply to the metrics you care about the most. This is when you run into three important questions: Which metrics should you focus on? Which metrics should you focus on?

article thumbnail

Cumulative Layout Shift: What it measures, when it works (and doesn't), and how to use it

Speed Curve

The newcomer to the scene was Cumulative Layout Shift (CLS), and, not surprisingly, it's the metric that's gotten the most questions. Does it correlate to user behaviour or business metrics in any measurable way? While I understand why score-based metrics add value, I'm a visual person. How is it calculated? is considered poor.

Retail 80
article thumbnail

NEW: Compare ALL the things!

Speed Curve

One of the huge benefits of tracking web performance over time is the ability to see trends and compare metrics. While you've always had the ability to do this in SpeedCurve, we recently added new functionality that makes it much easier for you to bookmark and compare different Synthetic tests in your test history.

Metrics 61