Remove Benchmarking Remove Comparison Remove Traffic Remove Virtualization
article thumbnail

Why you should benchmark your database using stored procedures

HammerDB

HammerDB uses stored procedures to achieve maximum throughput when benchmarking your database. HammerDB has always used stored procedures as a design decision because the original benchmark was implemented as close as possible to the example workload in the TPC-C specification that uses stored procedures. On MySQL, we saw a 1.5X

article thumbnail

The Speed of Time

Brendan Gregg

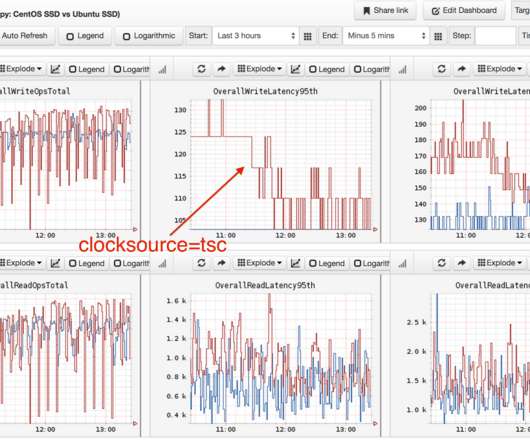
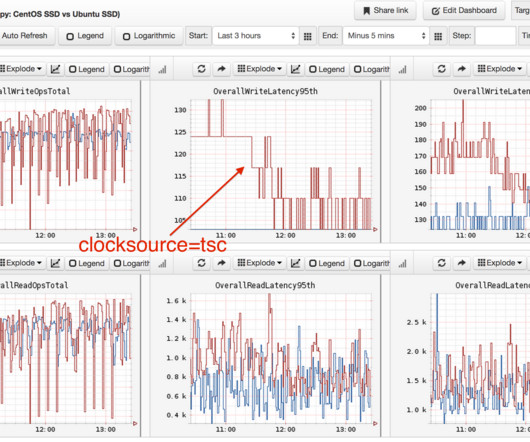
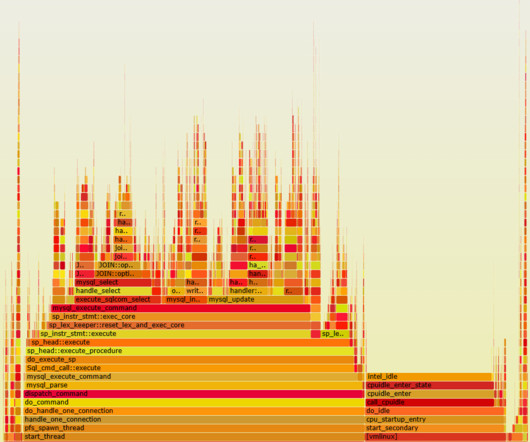
CLI tools The Cassandra systems were EC2 virtual machine (Xen) instances. Since instances of both CentOS and Ubuntu were running in parallel, I could collect flame graphs at the same time (same time-of-day traffic mix) and compare them side by side. A quick check of basic performance statistics showed over 30% higher CPU consumption.

Speed 126
Insiders

Sign Up for our Newsletter

This site is protected by reCAPTCHA and the Google Privacy Policy and Terms of Service apply.

Trending Sources

article thumbnail

The Speed of Time

Brendan Gregg

CLI tools The Cassandra systems were EC2 virtual machine (Xen) instances. Since instances of both CentOS and Ubuntu were running in parallel, I could collect flame graphs at the same time (same time-of-day traffic mix) and compare them side by side. A quick check of basic performance statistics showed over 30% higher CPU consumption.

Speed 52
article thumbnail

The Speed of Time

Brendan Gregg

CLI tools The Cassandra systems were EC2 virtual machine (Xen) instances. Since instances of both CentOS and Ubuntu were running in parallel, I could collect flame graphs at the same time (same time-of-day traffic mix) and compare them side by side. A quick check of basic performance statistics showed over 30% higher CPU consumption.

Speed 40
article thumbnail

5 Must-Have Features of Top Synthetic Monitoring Tools

Rigor

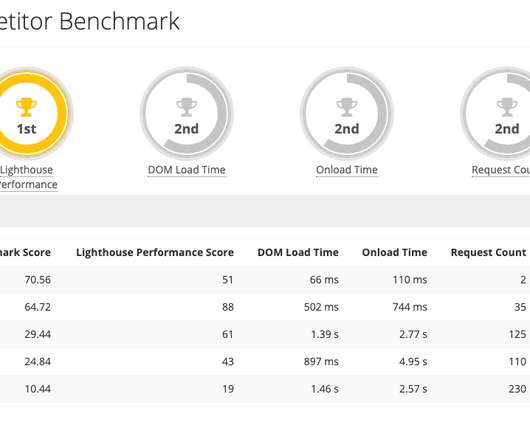
For example, here is what a comparison report looks like in Rigor. One of the key strengths of synthetic monitoring solutions is that they can help you assess the performance and user experience (UX) of a site without requiring large volumes of real users driving traffic, a known weakness RUM or APM solutions.

article thumbnail

A Management Maturity Model for Performance

Alex Russell

Treating data as a distribution fundamentally enables comparison and experimentation because it creates a language for describing non-binary shifts. This often happens out of an ad-hoc virtual team that forms in earlier stages but is now formalised and has long-term staffing. Management Attributes #.

article thumbnail

Front-End Performance Checklist 2021

Smashing Magazine

Alternatively, you can also use: Addy Osmani’s Chrome UX Report Compare Tool , Speed Scorecard (also provides a revenue impact estimator), Real User Experience Test Comparison or SiteSpeed CI (based on synthetic testing). CrUX generates an overview of performance distributions over time, with traffic collected from Google Chrome users.