Remove Benchmarking Remove Comparison Remove Google Remove Traffic
article thumbnail

Implementing service-level objectives to improve software quality

Dynatrace

Instead, they can ensure that services comport with the pre-established benchmarks. First, it helps to understand that applications and all the services and infrastructure that support them generate telemetry data based on traffic from real users. SLOs improve software quality. So how can teams start implementing SLOs?

Software 263
article thumbnail

10 things I love about SpeedCurve (that I think you'll love, too)

Speed Curve

Benchmark your site against your competitors Our public-facing Industry Benchmarks dashboard gets a lot of visits, but did you know you can create your own custom competitive benchmarking dashboard in SpeedCurve? READ : How to create a competitive benchmark dashboard ––––– 4.

Insiders

Sign Up for our Newsletter

This site is protected by reCAPTCHA and the Google Privacy Policy and Terms of Service apply.

Trending Sources

article thumbnail

The State Of Mobile And Why Mobile Web Testing Matters

Smashing Magazine

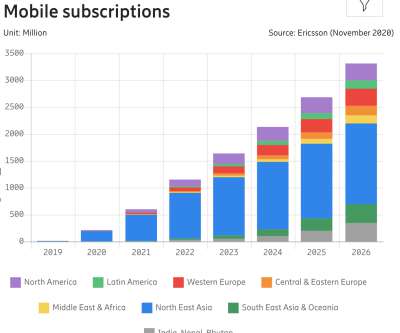
These days, with mobile traffic accounting for over 50% of web traffic , it’s fair to assume that the very first encounter of your prospect customers with your brand will happen on a mobile device. With Core Web Vitals , Google has been pushing the experience factors on mobile further to the forefront. billion by 2026.

Mobile 133
article thumbnail

5 Must-Have Features of Top Synthetic Monitoring Tools

Rigor

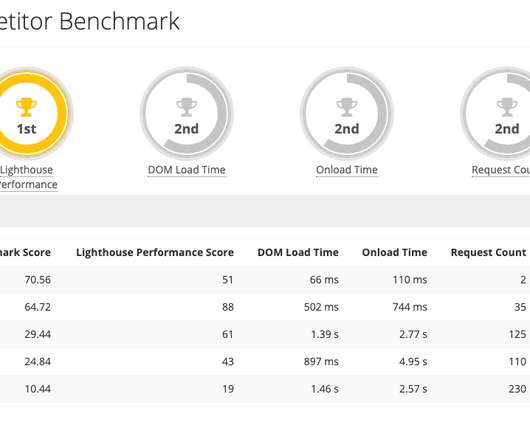
For example, here is what a comparison report looks like in Rigor. One of the key strengths of synthetic monitoring solutions is that they can help you assess the performance and user experience (UX) of a site without requiring large volumes of real users driving traffic, a known weakness RUM or APM solutions.

article thumbnail

Front-End Performance Checklist 2021

Smashing Magazine

Assets Optimizations Brotli, AVIF, WebP, responsive images, AV1, adaptive media loding, video compression, web fonts, Google fonts. Run performance experiments and measure outcomes — both on mobile and on desktop (for example, with Google Analytics ). Adjust the argument depending on the group of stakeholders you are speaking to.

article thumbnail

Front-End Performance Checklist 2020 [PDF, Apple Pages, MS Word]

Smashing Magazine

Run performance experiments and measure outcomes — both on mobile and on desktop (for example, with Google Analytics ). Alternatively, you can also use Speed Scorecard (also provides a revenue impact estimator), Real User Experience Test Comparison or SiteSpeed CI (based on synthetic testing). Large preview ). Large preview ).