Remove Benchmarking Remove Best Practices Remove Google Remove Video
article thumbnail

Implementing service-level objectives to improve software quality

Dynatrace

Instead, they can ensure that services comport with the pre-established benchmarks. In what follows, we explore some of these best practices and guidance for implementing service-level objectives in your monitored environment. Best practices for implementing service-level objectives. SLOs improve software quality.


Software 266
article thumbnail

An Opinionated Guide to Performance Budgets

Speed Curve

Throughout this post I've used examples from our public Industry Benchmarks dashboard , which I'd encourage you to check out so that you can explore these metrics on your own. Tracking critical content such as images and videos is a good place to start. > Cumulative Layout Shift (CLS) is another one of Google's Core Web vitals.

Insiders

Sign Up for our Newsletter

This site is protected by reCAPTCHA and the Google Privacy Policy and Terms of Service apply.

Trending Sources

article thumbnail

Performance audit: Lego.com

Speed Curve

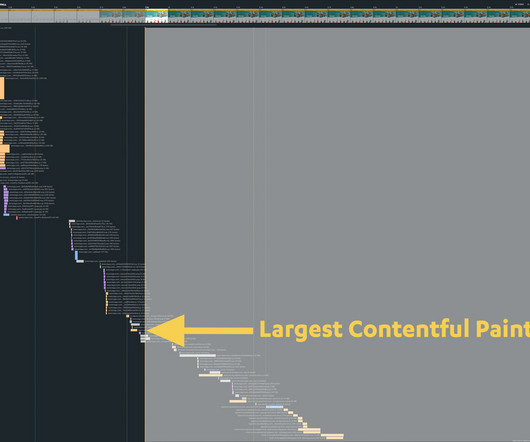
We track LEGO.com, along with a handful of other leading ecommerce sites, in our public-facing Retail Benchmarks dashboard , which I encourage you to check out. LCP measures when the largest visual element in the viewport – typically a hero image or video – finishes rendering. seconds, LCP lags at 3.96

article thumbnail

Getting started with web performance? Here's what you need to focus on.

Speed Curve

Inspired by that post, I wanted to dig a bit deeper into a few of the best practices they mentioned, which fall loosely into these three buckets: Analyze your pages – understand the critical rendering path and page composition. JavaScript, fonts, and video carry the bulk of the rest of the weight. Take Amazon, for example.

article thumbnail

Google Lighthouse vs Rigor

Rigor

One free tool has become prominent in the space – Google Lighthouse – and one question often bubbles up: “I use Google Lighthouse for one-off snapshots of my site’s performance, so why do I need a performance monitoring solution?” Where Google Lighthouse Shines Bright.

Google 51
article thumbnail

Ten years of page bloat: What have we learned?

Speed Curve

How does page bloat affect other metrics, such as Google's Core Web Vitals? A Google machine-learning study I participated in a few years ago found that the total number of page elements was the single greatest predictor of conversions. You can dive deeper into image optimization and SEO tips in this article in Google Search Central.).

Mobile 145
article thumbnail

Web Performance for Product Managers

Speed Curve

There are a ton of best practices for front-end developers to follow. This includes: waterfall charts with details about every request, filmstrips and videos that help you visualize the rendering experience, and. There is nothing better than showing a before-and-after video when promoting the great work of your team.