Remove Analytics Remove Course Remove Metrics Remove Retail
article thumbnail

Frictionless retail: A pandemic imperative for IT

Dynatrace

For most who work in the retail sector, the pandemic has been an unwelcome test of our ability to cope with disruption. In eight months, retailers offering curbside pickup increased from 7% to 44%, reflecting rapidly changing consumer preferences. These are, of course, important questions. Dynatrace news. Source: McKinsey ).

Retail 132
article thumbnail

Intelligent, context-aware AI analytics for all your custom metrics

Dynatrace

Dynatrace recently opened up the enterprise-grade functionalities of Dynatrace OneAgent to all the data needed for observability, including metrics, events, logs, traces, and topology data. Davis topology-aware anomaly detection and alerting for your custom metrics. Seamlessly report and be alerted on topology-related custom metrics.

Metrics 244
Insiders

Sign Up for our Newsletter

This site is protected by reCAPTCHA and the Google Privacy Policy and Terms of Service apply.

Trending Sources

article thumbnail

Increased focus for your teams with fine-grained access control for your Prometheus, StatsD, and Telegraf metrics

Dynatrace

Recently, we simplified StatsD, Telegraf, and Prometheus observability by allowing you to capture and analyze all your custom metrics. Gain fine-grained access control for Prometheus, StatsD, and Telegraf metrics. To achieve this, you can now grant access to any single metric within a Dynatrace management zone.

Metrics 196
article thumbnail

A Day in the Life of an Experimentation and Causal Inference Scientist @ Netflix

The Netflix TechBlog

Together with data analytics and data engineering, we comprise the larger, centralized Data Science and Engineering group. We talked to scientists from areas like Payments & Partnerships, Content & Marketing Analytics Research, Content Valuation, Customer Service, Product Innovation, and Studio Production.

Analytics 207
article thumbnail

Introducing Page Speed Benchmarks – a new resource for the performance community

Speed Curve

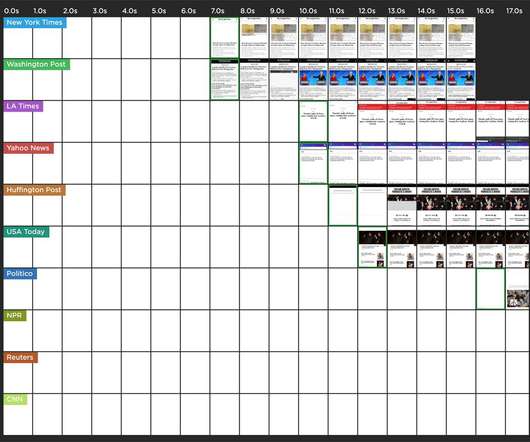
Here are some common questions I’m asked when I talk with people about performance: Which metrics should I care about? Page Speed Benchmarks is an interactive dashboard that lets you explore and compare web performance data for leading websites across several industries – from retail to media. How fast should I be?

article thumbnail

Debugging Interaction to Next Paint (INP)

Speed Curve

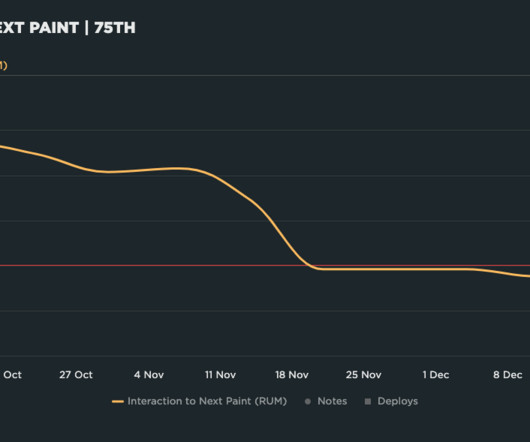
Heatmap of the most popular pages and their Web Vitals metrics I then typically switch to the RUM > Design dashboard and use the list of popular interaction elements to determine which ones I want to investigate further. Long interaction when opening the menu on H&M Let's compare this to another fashion retailer, French Connection.

article thumbnail

What Is Hyperautomation?

O'Reilly

We can see what books and courses our customers are using, and for how long. The data available to our retail business is much more limited. The online business is information-rich; the retail business is information-poor. As a result, your relationship to many important financial metrics changes. That’s the bad news.

Games 116