article thumbnail

Embrace enterprise-wide observability and security with Foundation & Discovery

Dynatrace

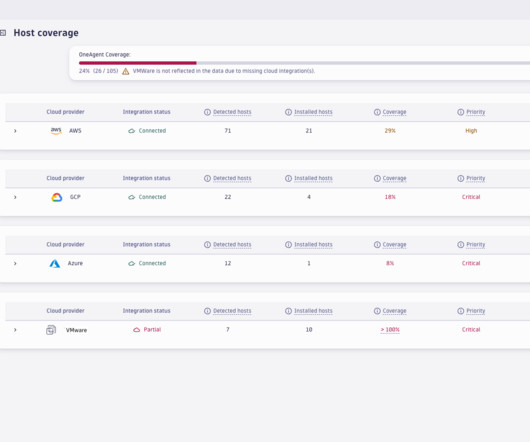
Removing blind spots proactively prevents security incidents and ensures that performance metrics reflect the true state of the environment. Basic Monitoring Host health includes fundamental host health indicators, such as whether the host is up/down, and other key metrics, including CPU, memory, disk, and network.

Analytics 173
article thumbnail

Perform 2023 Guide: Organizations mine efficiencies with automation, causal AI

Dynatrace

In what follows, we explore some key cloud observability trends in 2023, such as workflow automation and exploratory analytics. From data lakehouse to an analytics platform Traditionally, to gain true business insight, organizations had to make tradeoffs between accessing quality, real-time data and factors such as data storage costs.

Insiders

Sign Up for our Newsletter

This site is protected by reCAPTCHA and the Google Privacy Policy and Terms of Service apply.

Trending Sources

article thumbnail

OpenTelemetry enables automated operations management at scale

Dynatrace

Gartner has estimated that 70% of new cloud-native application monitoring will use open source instrumentation by 2025. More than 20 leading cloud and operations analytics vendors have added support to their products — including Dynatrace, which is one of the top contributors to the project. ” Extended visibility.

article thumbnail

How digital experience monitoring helps deliver business observability

Dynatrace

Fast, consistent application delivery creates a positive user experience that can ultimately drive customer loyalty and improve business metrics like conversion rate and user retention. Expanding on the traditional observability pillars of metrics, logs, and traces, DEM collects user experience data to complete the end-to-end picture.

article thumbnail

How low-code/no-code AutomationEngine advances automated workflows

Dynatrace

Further, according to a Gartner® report, by 2025, 95% of decisions that currently use data will be at least partially automated.* The Dynatrace Grail data lakehouse enables teams to ingest logs, metrics, traces, business events, and other data to get a full picture of their hybrid and multicloud environments.

Code 211
article thumbnail

APM tools vs. APM platform: What’s the difference?

Dynatrace

Application performance monitoring involves tracking key software application performance metrics using monitoring software and telemetry data. Application performance monitoring has a strong focus on specific metrics and measurements. Application performance management.

article thumbnail

What is ITOps? Why IT operations is more crucial than ever in a multicloud world

Dynatrace

In fact, Gartner estimates that 80% of enterprises will shut down their on-premises data centers by 2025. ITOps teams use more technical IT incident metrics, such as mean time to repair, mean time to acknowledge, mean time between failures, mean time to detect, and mean time to failure, to ensure long-term network stability.