Remove 2016 Remove Benchmarking Remove Latency Remove Speed
article thumbnail

SQL Server 2016 – It Just Runs Faster: Always On Availability Groups Turbocharged

SQL Server According to Bob

Performance issues surrounding Availability Groups typically were related to disk I/O or network speeds. Our customers who deployed Availability Groups were now using servers for primary and secondary replicas with 12+ core sockets and flash storage SSD arrays providing microsecond to low millisecond latencies. one without a replica).

article thumbnail

The Surprising Effectiveness of Non-Overlapping, Sensitivity-Based Performance Models

John McCalpin

This was a keynote presentation at the “2nd International Workshop on Performance Modeling: Methods and Applications” (PMMA16), June 23, 2016, Frankfurt, Germany (in conjunction with ISC16 ). Building separate models for each of the benchmarks was required to get the correct asymptotic properties.

Insiders

Sign Up for our Newsletter

This site is protected by reCAPTCHA and the Google Privacy Policy and Terms of Service apply.

Trending Sources

article thumbnail

The Performance Inequality Gap, 2021

Alex Russell

Back in 2016, I gave a talk outlining the causes and effects of the terrible performance of web apps built using popular tools on the fastest-growing device segment: low-end to mid-range Android phones. In 2016, Jio swept over the subcontinent like a monsoon dropping a torrent of 4G infrastructure and free data rather than rain.

article thumbnail

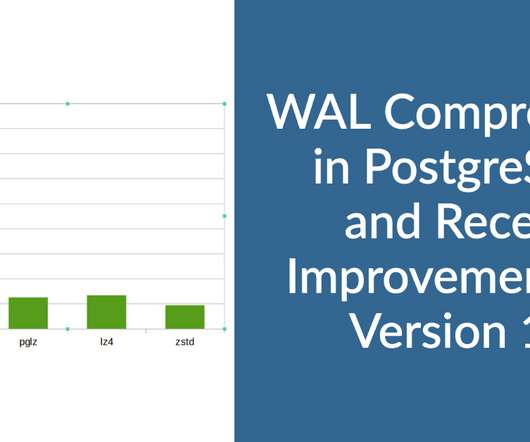
WAL Compression in PostgreSQL and Recent Improvements in Version 15

Percona

Some of the built-in features ( wal_compression ) have been there since 2016, and almost all backup tools do the WAL compression before taking it to the backup repository. Individual processes generate WAL records, and latency is very crucial for transactions. But this comes with a considerable performance implication.

Database 116
article thumbnail

AMD EPYC Processors in Azure Virtual Machines

SQL Performance

This processor has a base clock speed of 2.0GHz, with an all-core boost speed of 2.55GHz, and a max boost clock speed of 3.0GHz. I wrote about using CPU-Z to benchmark the Intel Xeon E5-2673 v3 processor in an Azure VM in this article. Figure 1: CPU-Z Benchmark Results for LS16v2. The L3 cache size is 64MB.

Azure 42
article thumbnail

A Management Maturity Model for Performance

Alex Russell

This is a complex topic, but to borrow from a recent post , web performance expands access to information and services by reducing latency and variance across interactions in a session, with a particular focus on the tail of the distribution (P75+). Consistent performance matters just as much as low average latency.

article thumbnail

Fixing a slow site iteratively

CSS - Tricks

Google’s industry benchmarks from 2018 also provide a striking breakdown of how each second of loading affects bounce rates. Speed is also something Google considers when ranking your website placement on mobile. Speed is also something Google considers when ranking your website placement on mobile.

Cache 92