Remove Efficiency Remove Speed Remove Video Remove Website Performance
article thumbnail

Improving The Performance Of Wix Websites (Case Study)

Smashing Magazine

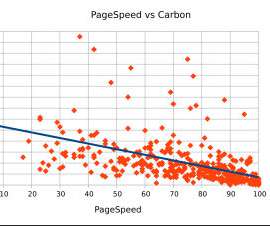
We deployed these enhancements gradually over time to ensure that our users didn’t experience any disruptions, but instead only a consistent improvement of their site speed. Since implementing these changes, we have seen a dramatic improvement in the performance of websites built and hosted on our platform.

Website 126
article thumbnail

How To Boost Media Performance On A Budget

Smashing Magazine

However, just as out-of-control spending bodes ill in the long run, so does unbudgeted digital media decimate site performance. Of the many factors that affect page-load speed, media is a significant one. With clearly documented performance goals, various teams can have meaningful conversations about the optimal delivery of content.

Media 118
Insiders

Sign Up for our Newsletter

This site is protected by reCAPTCHA and the Google Privacy Policy and Terms of Service apply.

Trending Sources

article thumbnail

Reducing Carbon Emissions On The Web

Smashing Magazine

Recommended reading : How Improving Website Performance Can Help Save The Planet. The mean average emissions for websites with a PageSpeed score of 100 is about 1 gram of carbon, which rises to a projected almost 6 grams for websites with a score of 0. The good news is that, as developers, we can do an awful lot about it.

Website 135
article thumbnail

Why is Wordpress Slow?

KeyCDN

But this article won't just help you figure out why your WordPress website is not fast enough. We will also discuss how you can speed up your slow WordPress site. Quite a number of brands prefer WordPress to maintain their website. Apart from that, several other factors should be taken care of to ensure that the website is fast.

Cache 52
article thumbnail

Optimizing Web Performance: Understanding Waterfall Charts

Dotcom-Montior

Waterfall charts let us see a cascade effect over several tasks, and in the matter of a few seconds, the user can see how bad/good the performance of the website is, such as how many resources are blocking parallel downloads or how many rows exist. Users can also watch the actual URL loading video in the browser window.

article thumbnail

Front-End Performance Checklist 2021

Smashing Magazine

Defining The Environment Choosing a framework, baseline performance cost, Webpack, dependencies, CDN, front-end architecture, CSR, SSR, CSR + SSR, static rendering, prerendering, PRPL pattern. Assets Optimizations Brotli, AVIF, WebP, responsive images, AV1, adaptive media loding, video compression, web fonts, Google fonts.