article thumbnail

How Caches Become Databases – And Why You Don’t Want This

VoltDB

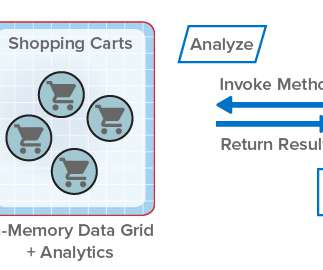
The most obvious and common way this happens is when companies try to evolve their caches into a data platform that can, for example, be used as highly available enterprise key-value stores for volatile data. Let’s look at a typical scenario involving the javax cache API, also known as JSR107. How hard can it be?

Cache 52
article thumbnail

AI-driven analysis of Spring Micrometer metrics in context, with typology at scale

Dynatrace

Spring Boot, on the other hand, is a Java framework for building cloud-native Java applications. It exports any pre-instrumented metrics for JVM, CPU Usage, Spring MVC, and WebFlux request latencies, cache utilization, data source utilization as well as custom metrics to the Dynatrace Metrics API v2. of Micrometer.

Metrics 196
Insiders

Sign Up for our Newsletter

This site is protected by reCAPTCHA and the Google Privacy Policy and Terms of Service apply.

Trending Sources

article thumbnail

AI-driven analysis of Spring Micrometer metrics in context, with topology at scale

Dynatrace

Spring Boot, on the other hand, is a Java framework for building cloud-native Java applications. It exports any pre-instrumented metrics for JVM, CPU Usage, Spring MVC, and WebFlux request latencies, cache utilization, data source utilization as well as custom metrics to the Dynatrace Metrics API v2. of Micrometer.

Metrics 130
article thumbnail

Seamlessly Swapping the API backend of the Netflix Android app

The Netflix TechBlog

This allows the app to query a list of “paths” in each HTTP request, and get specially formatted JSON (jsonGraph) that we use to cache the data and hydrate the UI. service with a composable JavaScript API that made downstream microservice calls, replacing the old Java API. Java…Script? It was a Node.js

Latency 233
article thumbnail

Analyzing a High Rate of Paging

Brendan Gregg

Reads usually have apps waiting on them; writes may not (write-back caching). biolatency From [bcc], this eBPF tool shows a latency histogram of disk I/O. total used free shared buff/cache available Mem: 64414 15421 349 5 48643 48409 Swap: 0 0 0. This is a 64-Gbyte memory system, and 48 Gbytes is in the page cache.

Cache 105
article thumbnail

Seeing through hardware counters: a journey to threefold performance increase

The Netflix TechBlog

We decided to move one of our Java microservices?—?let’s A quick canary test was free of errors and showed lower latency, which is expected given that our standard canary setup routes an equal amount of traffic to both the baseline running on 4xl and the canary on 12xl. The problem It started off as a routine migration.

Hardware 363