Remove AWS Remove Latency Remove Traffic Remove Tuning
article thumbnail

Build and operate multicloud FaaS with enhanced, intelligent end-to-end observability

Dynatrace

For example, to handle traffic spikes and pay only for what they use. These functions are executed by a serverless platform or provider (such as AWS Lambda, Azure Functions or Google Cloud Functions) that manages the underlying infrastructure, scaling and billing. Scale automatically based on the demand and traffic patterns.

article thumbnail

Save Money in AWS RDS: Don’t Trust the Defaults

Percona

Want to save money on your AWS RDS bill? I’ll show you some MySQL settings to tune to get better performance, and cost savings, with AWS RDS. Default settings can help you get started quickly – but they can also cost you performance and a higher cloud bill at the end of the month.

AWS 122
Insiders

Sign Up for our Newsletter

This site is protected by reCAPTCHA and the Google Privacy Policy and Terms of Service apply.

Trending Sources

article thumbnail

How Dynatrace boosts production resilience with Site Reliability Guardian

Dynatrace

While the first guardian validates the traffic, the second guardian checks the business transactions generated during the observation period. More precisely, this team uses AWS Fault Injection Simulator (FIS) to run fault injection to improve the application’s performance and resiliency.

DevOps 183
article thumbnail

Building Netflix’s Distributed Tracing Infrastructure

The Netflix TechBlog

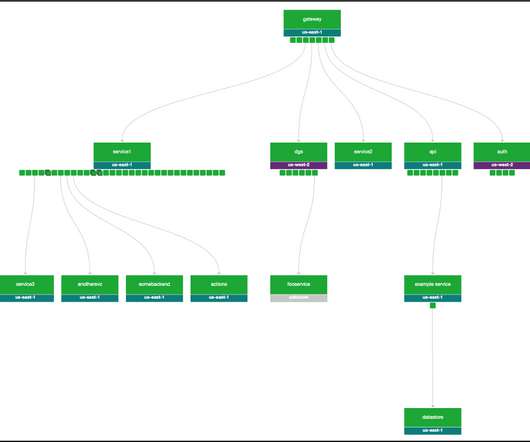
If we had an ID for each streaming session then distributed tracing could easily reconstruct session failure by providing service topology, retry and error tags, and latency measurements for all service calls. Our engineering teams tuned their services for performance after factoring in increased resource utilization due to tracing.

article thumbnail

Monitoring Serverless Applications

Dotcom-Montior

those resources now belong to cloud providers, such as AWS Lambda, Google Cloud Platform, Microsoft Azure, and others. Developers don’t have to put in additional time to fine-tuning the system, or rely on other teams for support, as it’s done automatically with the cloud provider. Focus on Application Development.

article thumbnail

Migrating Netflix to GraphQL Safely

The Netflix TechBlog

The control group’s traffic utilized the legacy Falcor stack, while the experiment population leveraged the new GraphQL client and was directed to the GraphQL Shim. To determine customer impact, we could compare various metrics such as error rates, latencies, and time to render.

Traffic 353
article thumbnail

The road to observability demo part 3: Collect, instrument, and analyze telemetry data automatically with Dynatrace

Dynatrace

It is available for the major OS and cloud platforms (for example, Windows, Linux, Solaris, AWS, Azure, and more) and only requires the deployment of a single service to monitor its environment. OneAgent is the native telemetry data collector and monitoring solution of Dynatrace.

Metrics 168