Remove Analysis Remove Azure Remove Metrics Remove Tuning
article thumbnail

Build and operate multicloud FaaS with enhanced, intelligent end-to-end observability

Dynatrace

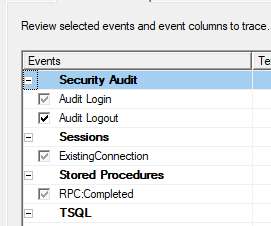
These functions are executed by a serverless platform or provider (such as AWS Lambda, Azure Functions or Google Cloud Functions) that manages the underlying infrastructure, scaling and billing. Observability is typically achieved by collecting three types of data from a system, metrics, logs and traces.

article thumbnail

Dynatrace innovates again with the release of topology-driven auto-adaptive metric baselines

Dynatrace

With the advent and ingestion of thousands of custom metrics into Dynatrace, we’ve once again pushed the boundaries of automatic, AI-based root cause analysis with the introduction of auto-adaptive baselines as a foundational concept for Dynatrace topology-driven timeseries measurements. Custom log metrics.

Metrics 213
Insiders

Sign Up for our Newsletter

This site is protected by reCAPTCHA and the Google Privacy Policy and Terms of Service apply.

Trending Sources

article thumbnail

Dynatrace SaaS release notes version 1.239

Dynatrace

To stay tuned, keep an eye on our release notes. Log data analysis. You can create custom log metrics for smarter and faster troubleshooting, and you will be able to understand log data in the context of your full stack, including real user impacts. Configuration API for AWS and Azure supporting services. Log Monitoring.

Azure 218
article thumbnail

Bandwidth-friendly Query Profiling for Azure SQL Database

SQL Performance

SQL Server has always provided the ability to capture actual queries in an easily-consumable rowset format – first with legacy SQL Server Profiler, later via Extended Events, and now with a combination of those two concepts in Azure SQL Database. Although this can be somewhat helpful, it is not the same.

Azure 96
article thumbnail

Dynatrace extends automatic and intelligent observability to cloud and Kubernetes logs for smarter automation at scale

Dynatrace

Leveraging cloud-native technologies like Kubernetes or Red Hat OpenShift in multicloud ecosystems across Amazon Web Services (AWS) , Microsoft Azure, and Google Cloud Platform (GCP) for faster digital transformation introduces a whole host of challenges. Dynatrace news. Collecting data requires massive and ongoing configuration efforts.

Cloud 260
article thumbnail

The road to observability demo part 3: Collect, instrument, and analyze telemetry data automatically with Dynatrace

Dynatrace

Making applications observable—relying on metrics, logs, and traces to understand what software is doing and how it’s performing—has become increasingly important as workloads are shifting to multicloud environments. We also introduced our demo app and explained how to define the metrics and traces it uses.

Metrics 173
article thumbnail

Why log monitoring and log analytics matter in a hyperscale world

Dynatrace

Log monitoring, log analysis, and log analytics are more important than ever as organizations adopt more cloud-native technologies, containers, and microservices-based architectures. Driving this growth is the increasing adoption of hyperscale cloud providers (AWS, Azure, and GCP) and containerized microservices running on Kubernetes.

Analytics 211