


The Speed of Time
Brendan Gregg
SEPTEMBER 25, 2021
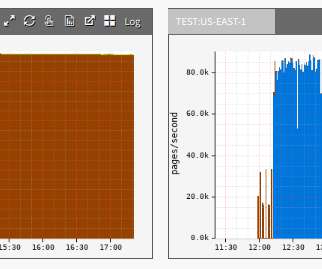
These strange questions came to the fore back in 2014 when Netflix was switching services from CentOS Linux to Ubuntu, and I helped debug several weird performance issues including one I'll describe here. A Cassandra database cluster had switched to Ubuntu and noticed write latency increased by over 30%. How would you _time_ time?


Let's personalize your content