Remove Latency Remove Open Source Remove Traffic Remove Transportation
article thumbnail

Building Netflix’s Distributed Tracing Infrastructure

The Netflix TechBlog

If we had an ID for each streaming session then distributed tracing could easily reconstruct session failure by providing service topology, retry and error tags, and latency measurements for all service calls. Our trace data collection agent transports traces to Mantis job cluster via the Mantis Publish library.

article thumbnail

How We Optimized Performance To Serve A Global Audience

Smashing Magazine

As an online booking platform, we connect travelers with transport providers worldwide, offering bus, ferry, train, and car transfers in over 30 countries. We aim to eliminate the complexity and hassle associated with travel planning by providing a one-stop solution for all transportation needs. Bookaway site search.

Insiders

Sign Up for our Newsletter

This site is protected by reCAPTCHA and the Google Privacy Policy and Terms of Service apply.

Trending Sources

article thumbnail

DBLog: A Generic Change-Data-Capture Framework

The Netflix TechBlog

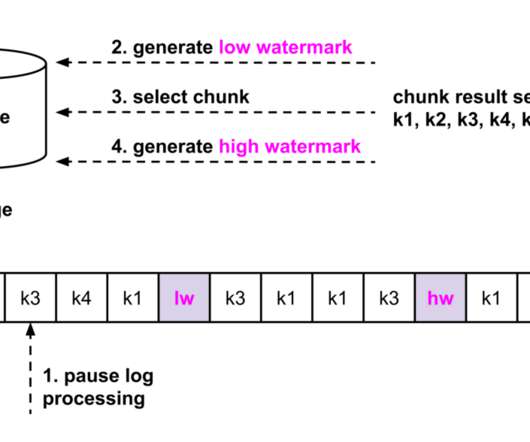
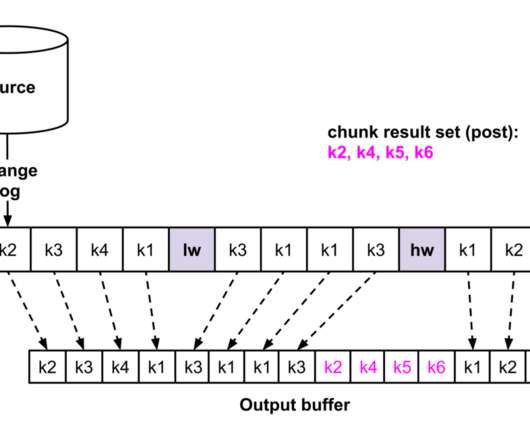
There are several open source CDC projects, often using the same underlying libraries, database APIs, and protocols. No locks on tables are ever acquired, which prevent impacting write traffic on the source database. Hence, downstream consumers receive change events as they occur on a source.

Database 197
article thumbnail

DBLog: A Generic Change-Data-Capture Framework

The Netflix TechBlog

There are several open source CDC projects, often using the same underlying libraries, database APIs, and protocols. No locks on tables are ever acquired, which prevent impacting write traffic on the source database. Hence, downstream consumers have confidence to receive change events as they occur on a source.

Database 212
article thumbnail

Data Movement in Netflix Studio via Data Mesh

The Netflix TechBlog

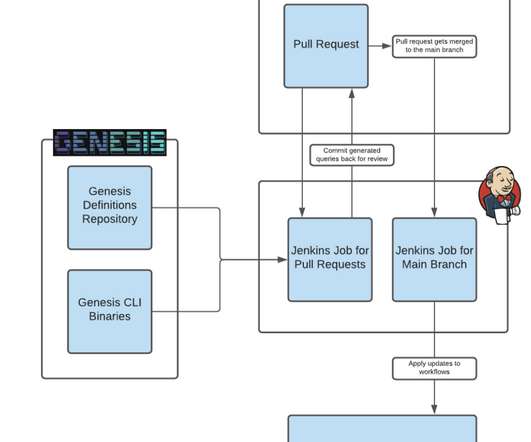
Operational Reporting is a reporting paradigm specialized in covering high-resolution, low-latency data sets, serving detailed day-to-day activitiesÂą and processes of a business domain. Operational Reporting Pipeline Example Iceberg Sink Apache Iceberg is an open source table format for huge analytics datasets.

Big Data 253
article thumbnail

Front-End Performance Checklist 2021

Smashing Magazine

CrUX generates an overview of performance distributions over time, with traffic collected from Google Chrome users. dashboard (open source), SpeedCurve and Calibre are just a few of them, and you can find more tools on perf.rocks. You can create your own on Chrome UX Dashboard. Large preview ). Large preview ).

article thumbnail

Front-End Performance Checklist 2020 [PDF, Apple Pages, MS Word]

Smashing Magazine

dashboard (open source), SpeedCurve and Calibre are just a few of them, and you can find more tools on perf.rocks. For Mac OS, we can use Network Link Conditioner , for Windows Windows Traffic Shaper , for Linux netem , and for FreeBSD dummynet. Large preview ). There are many tools allowing you to achieve that: SiteSpeed.io